
Key findings
Real but slow, and held back by markets more than by technology
Between 12 September and 8 November 2026, 104 experts from the IEA Hydrogen TCP Task 52 network completed a structured online survey on hydrogen-based iron and steelmaking. They come from 20 countries and from industry, universities and research institutes, governments, intergovernmental bodies and NGOs. Each expert answered the modules they know best. Quantities were asked as a low, best and high estimate, and dates as probabilities, so uncertainty is also recorded. The result is not another model scenario. It is a measured record of what the people building, financing, regulating and studying this industry expect, and of where they disagree.
The survey covers the whole chain in nine linked modules: ore quality, hydrogen supply, plant flexibility, trade routes, power systems, finance, policy and buyer behaviour. It reports the spread of opinion as well as the central view. Experts agree that scrap-based EAF is the safe investment and that green iron will be made where firmed renewable power is cheapest. They disagree on how much iron will be traded, and when. The survey also asked what knowledge is missing. Carbon accounting and certification rules top that list, which tells Task 52 and its partners where work is needed most.
Their message is clear: hydrogen-based direct reduction is coming, but slowly. They expect it to be commercially proven at shaft-furnace scale by the end of this decade, and to make about 6% of the world's steel by 2040. Costs converge with the blast furnace in the late 2030s. What holds it back is not the technology. It is offtake, energy prices and whether policy support will last. Four in five experts name uncertain offtake and the green premium as the main barrier to investment.
The twelve findings below summarise the results. Each links to the full result and its chart.
- 1
Hydrogen DRI makes 6% of steel in 2040
We asked the experts
Allocate global crude steel production in 2040 across production routes (percent, summing to 100).
Q8Box: interquartile range · thick line: median · whiskers: min–max · number: median · purple line: reference value
Hydrogen-based DRI-EAF is expected to make 6% of global crude steel in 2040 (median; interquartile range 3 to 10%), behind unabated BF-BOF at 42%, scrap-based EAF at 30% and natural-gas DRI-EAF at 12% Q8, n=88.
- 2
Ten million tonnes of capacity around 2037
We asked the experts
In which year will at least 10 million tonnes per year of hydrogen-based DRI capacity be in commercial operation globally?
Q910% chance by
2032
IQR 2030–2035 · never: 1
50% chance by
2037
IQR 2035–2040 · never: 1
90% chance by
2042
IQR 2040–2050 · never: 2
Pooled cumulative probability: average of each expert's piecewise-linear curve through their 10%, 50% and 90% years.
Ten million tonnes a year of hydrogen-based DRI capacity is expected in the late 2030s: the pooled probability curve crosses 50% in 2037, and the median expert puts the even-odds year at 2037 (IQR 2035 to 2040) Q9, n=89.
- 3
Cost parity only in the late 2030s
We asked the experts
What production-cost premium will hydrogen-based DRI-EAF crude steel carry over BF-BOF in the best-in-class location, excluding carbon pricing and subsidies?
Q10Below BF-BOF cost0 to 10%10 to 25%25 to 50%Above 50%Number at right: mean scoreIn 2030, 74% of experts expect hydrogen DRI-EAF steel to cost at least 25% more than BF-BOF steel in the best location, before carbon prices and subsidies. By 2040, 82% expect the premium to be 25% or less, and 41% expect 10% or less Q10, n=84.
- 4
Offtake, not technology, blocks investment
We asked the experts
Rank the three biggest barriers to reaching final investment decision on commercial-scale hydrogen-based ironmaking projects today.
Q11Borda score as a share of the maximum (rank 1 = 3 points, rank 3 = 1 point) · share ranking it first.
The two barriers to final investment decision that dominate everything else are offtake and green-premium uncertainty (ranked first by 44%, mentioned by 80%) and hydrogen or electricity price risk (ranked first by 32%, mentioned by 70%). First-of-a-kind technology risk is mentioned by only 13% Q11, n=98.
- 5
Lead markets and grants now, carbon pricing later
We asked the experts
Rank the three policy instruments that would most accelerate hydrogen-based ironmaking deployment over the next five years.
Q12Borda score as a share of the maximum (rank 1 = 3 points, rank 3 = 1 point) · share ranking it first.
For the next five years, experts favour lead markets or quotas for near-zero steel and capital grants for first plants, now almost level, with carbon contracts for difference third Q12, n=92. After 2030 they trust domestic carbon pricing (mean 4.1 of 5) and border carbon adjustment (also 4.1) most to sustain the industry Q66, n=33, and a rising, predictable carbon price is the clearest least-regret policy, ranked first by 56% Q75, n=36.
- 6
Gas first, hydrogen later
We asked the experts
For commercial-scale DRI projects reaching final investment decision in 2026 to 2028, which initial reductant configuration do you expect to be most common?
Q1664% expect new DRI projects to start on natural gas and switch to hydrogen later
Gas first, hydrogen later: 64% expect commercial DRI projects reaching investment decision in 2026 to 2028 to start on natural gas with a planned transition to hydrogen Q16, n=92, and 65% expect natural gas or methane injection to remain the dominant source of carbon in hydrogen DRI in 2035 Q26, n=43.
- 7
Hydrogen shaft furnaces are nearly ready
We asked the experts
When will the first commercial-scale plant (at least 1 Mt/yr) be operating for each route?
Q18Already operatingBy 20282029 to 20322033 to 20362037 to 2040After 2040NeverNumber at right: mean scoreShaft-furnace DRI on 100% hydrogen is rated TRL 7 to 8 by 71% of the technology module Q17, n=41, but the first commercial-scale plant of at least 1 Mt a year has slipped in the network's eyes: 49% expect one to be operating by 2028 or already, and a further 41% say 2029 to 2032 Q18, n=39. Hydrogen supply variability and buffering is the leading technical barrier to scale, ranked first by 63% Q21, n=41.
- 8
4 MWh of electricity per tonne of steel
We asked the experts
What total electricity input per tonne of crude steel will a best-in-class hydrogen-based DRI-EAF plant need in 2035, including electrolysis but excluding mining and pelletising?
Q204.0 MWh per tonne of crude steel for a best-in-class hydrogen DRI-EAF plant in 2035
A best-in-class hydrogen DRI-EAF plant in 2035 is expected to need 4.0 MWh of electricity per tonne of crude steel (IQR 3.5 to 4.5; Q20, n=33), and a first-of-a-kind plant is expected to run at 65% of nameplate over its first two years (IQR 55 to 70%; Q25, n=33).
- 9
USD 165 per tonne of CO2 for parity in Europe
We asked the experts
What carbon price would make hydrogen-based DRI-EAF steel cost-competitive with unabated BF-BOF in Europe in 2030, without other subsidies?
Q61USD 165 carbon price per tonne of CO2 for hydrogen steel to match unabated BF-BOF in Europe in 2030
Delivered low-emission hydrogen in a best-in-class location is expected to cost USD 3.0 per kilogram in 2035 (IQR 2.5 to 4.4; Q62, n=34). A carbon price of USD 165 per tonne of CO2 (IQR 141 to 200) would make hydrogen DRI-EAF steel competitive with unabated BF-BOF in Europe in 2030 without other subsidies, higher than the USD 155 the first 84 responses implied Q61, n=30, and the pooled curve puts even odds of European cost parity, with carbon pricing and CBAM but no subsidies, in 2040 Q68, n=27.
- 10
Trade is the least settled topic
We asked the experts
What share of global hydrogen-based DRI/HBI output will be traded internationally as merchant iron in 2040, rather than consumed at the site of production?
Q1330% of hydrogen-based iron traded internationally in 2040; a liquid HBI market around 2040
Trade is the least settled topic. Experts expect 30% of hydrogen-based DRI/HBI output to be traded internationally in 2040 (IQR 20 to 50%; Q13, n=71) and 35 Mt a year of merchant hydrogen-based iron to be traded in 2035 (IQR 12.5 to 60; Q44, n=24); both are among the widest spreads in the whole elicitation. A liquid merchant HBI market is expected around 2040 Q53, n=22.
- 11
Buyers need a shared rulebook
We asked the experts
How much does each knowledge gap limit decisions by industry and governments today?
Q853.9 of 5 how much carbon accounting and certification rules limit decisions today, the top-rated knowledge gap
The knowledge gap that most limits decisions today is carbon accounting and certification rules (mean 3.9 of 5; Q85, n=63), ahead of comparisons of national policy packages and power-system integration. Buyers are expected to pay USD 50 to 100 per tonne for near-zero steel in 2030 (35%; Q83, n=66), and automotive is the only sector most experts see making rapid progress or largely transitioning by 2035 (56%; Q84, n=68).
- 12
Scrap-based EAF is the safe bet
We asked the experts
How robust is each pathway if renewable hydrogen still costs more than USD 4 per kilogram in 2035?
Q74Robust: still the right choiceTolerable: viable with supportAt risk of strandingNumber at right: mean scoreScrap-based EAF capacity and scrap sourcing is the clearest least-regret investment, ranked first by 61% Q72, n=36, and 85% judge it robust even if renewable hydrogen still costs more than USD 4 per kilogram in 2035; 58% judge blast furnaces with CCUS at risk of stranding in that world Q74, n=28.
The expert base
Who responded
One response per expert: four in ten from universities and research institutes, the rest from industry, policy, intergovernmental bodies and NGOs, with Europe, a global focus, Australia and China the most-named regions of expertise.
Share of respondents selecting each option.
Module 1 · 104 experts
Cross-cutting outlook
Hydrogen-based direct reduction is expected to be real but slow: a small share of steel by 2040, held back by offtake and energy prices more than by technology.
- Steel in 2040: unabated BF-BOF 42%, scrap EAF 30%, natural-gas DRI-EAF 12%, hydrogen DRI-EAF 6% (medians; Q8, n=88).
- Even odds of 10 Mt a year of hydrogen DRI capacity by 2037; the pooled curve passes 25% in 2033 and 75% in 2043 Q9, n=89.
- In 2030, 74% expect hydrogen steel to cost at least 25% more than BF-BOF steel; by 2040, 82% expect a premium of 25% or less Q10, n=84.
- Barriers to investment: offtake and green-premium uncertainty (named by 80%) and hydrogen or electricity price risk (70%); first-of-a-kind technology risk by only 13% Q11, n=98.
- For the next five years experts favour lead markets or quotas, then capital grants and carbon contracts for difference Q12, n=92; 64% expect new DRI projects to start on natural gas Q16, n=92.
Box: interquartile range · thick line: median · whiskers: min–max · number: median · purple line: reference value
Borda score as a share of the maximum (rank 1 = 3 points, rank 3 = 1 point) · share ranking it first.
Read the full analysis
Asked to allocate global crude steel production in 2040 across routes, the median expert gave 42% to unabated BF-BOF (IQR 30 to 50%, against roughly 70% today), 30% to scrap-based EAF (IQR 25 to 35%), 12% to natural-gas DRI-EAF with or without CCS (IQR 10 to 15%), 6% to hydrogen-based DRI-EAF including imported green iron (IQR 3 to 10%), 5% to BF-BOF with CCUS or hydrogen injection (IQR 3 to 10%) and 2% to other novel routes such as electrolysis, smelting reduction and plasma (IQR 1 to 3%) (Q8, n=88). This was among the most tightly clustered answers in the elicitation, and the medians barely moved as the sample grew. Experts put even odds on at least 10 Mt a year of hydrogen-based DRI capacity being in commercial operation in 2037 (median of the individual 50% years; IQR 2035 to 2040), with 10% years clustering at 2030 to 2031 and 90% years at 2042. The pooled cumulative curve reaches 25% in 2033, 50% in 2037 and 75% in 2043, and one expert answered never (Q9, n=89).
On cost, 46% expect hydrogen DRI-EAF crude steel in 2030 to carry a 25 to 50% production-cost premium over BF-BOF in the best-in-class location, excluding carbon pricing and subsidies, and 27% expect more than 50%. The centre of the distribution moves one band per five years: in 2035, 42% say 10 to 25% and 35% say 25 to 50%; in 2040, 40% say 10 to 25%, 37% say 0 to 10% and 5% expect hydrogen steel to be cheaper (Q10, n=84). The two barriers to final investment decision that stand out are offtake and green-premium uncertainty (63% of the maximum Borda score; ranked first by 44%) and hydrogen or electricity price risk (53%; first by 32%); the gap between them widened slightly with the later responses, which leaned towards offtake. Durability and predictability of policy support (20%) and carbon price and CBAM implementation uncertainty (18%) form a second tier; first-of-a-kind technology risk (9%), permitting and grid delays (7%), security of DR-grade ore supply (7%) and skilled workforce availability (2%) trail (Q11, n=98).
Policy preferences over the next five years are broad rather than concentrated, and the extra responses reshuffled the top of the list without changing its character. Lead markets or quotas for near-zero steel now lead on aggregate score (33% of maximum Borda score; first by 16%), just ahead of capital grants for first plants (28%), which, together with domestic carbon pricing, are the instruments most often ranked first (17% each). Carbon contracts for difference (25%; first by 14%) and domestic carbon pricing (23%; first by 17%) follow, then hydrogen production tax credits or subsidies (21%), green public procurement (17%), border carbon adjustment (16%) and bilateral trade agreements (16%). Harmonised definitions and certification scored lowest (4%) as an accelerator, although the markets module shows experts value it highly as a safeguard (Q12, n=92). Asked what share of hydrogen-based DRI/HBI output will be traded internationally as merchant iron in 2040 rather than consumed on site, the median best estimate was 30% (IQR 20 to 50%; individual estimates from 2% to 92%), one of the widest relative spreads in the whole elicitation (Q13, n=71).
On definitions, 52% want Task 52 to define near-zero emission iron and steel by a technology-neutral emissions-intensity threshold, 31% by a threshold combined with route eligibility rules, 13% prefer no single definition and multiple reported metrics, and 4% would define it by eligible routes (Q14, n=96). The boundary should be Scope 1 and 2 plus upstream Scope 3 (mining, ore processing and transport) for 62%, Scope 1 and 2 only for 26% and the full life cycle including downstream use for 11% (Q15, n=94). Finally, 64% expect the commercial-scale DRI projects reaching final investment decision in 2026 to 2028 to start on natural gas with a planned transition to hydrogen, 33% expect a mix differing by region and only two experts expect hydrogen from commissioning (Q16, n=92).
Module 2 · 47 experts
Technology readiness and process integration
Hydrogen shaft furnaces are close to commercial, but the first full-scale plant has slipped and hydrogen supply is the binding constraint.
- Shaft-furnace DRI on 100% hydrogen is rated TRL 7 to 8 by 71%; natural-gas DRI with hydrogen blending is TRL 9 for 59% Q17, n=41.
- First hydrogen shaft furnace of 1 Mt a year: 49% expect one by 2028 or already, 41% say 2029 to 2032 Q18, n=39.
- A best-in-class plant in 2035 needs 4.0 MWh of electricity per tonne of crude steel (IQR 3.5 to 4.5; Q20, n=33).
- Hydrogen supply variability and buffering is the top technical barrier to scale, ranked first by 63% Q21, n=41.
- A first-of-a-kind plant is expected to run at 65% of nameplate over its first two years (IQR 55 to 70%; Q25, n=33), and 65% expect natural gas to remain the main carbon source in hydrogen DRI in 2035 Q26, n=43.
Read the full analysis
Forty-seven experts chose this module, eight more than in the first cut, and the readiness picture barely moved. Shaft-furnace DRI on natural gas with 30% or more hydrogen blending is rated TRL 9 or above by 59% and TRL 7 to 8 by 39%. Shaft-furnace DRI on 100% hydrogen with DR-grade pellets sits at TRL 7 to 8 for 71% (20% say TRL 5 to 6, 10% say TRL 9). Blast furnaces with hydrogen injection (44% TRL 7 to 8, 32% TRL 9) and biomass or biochar-based ironmaking (39% and 39%) are rated similarly mature; BF-BOF with CCUS is mostly TRL 7 to 8 (54%). Hydrogen DRI with an electric smelting furnace for lower-grade ores is split between TRL 5 to 6 (48%) and TRL 7 to 8 (38%); fluidised-bed hydrogen reduction of fines is mostly TRL 5 to 6 (51%). Hydrogen plasma or smelting reduction (55% TRL 5 to 6, 45% TRL 1 to 4), low-temperature aqueous iron electrowinning (47% TRL 1 to 4) and molten oxide electrolysis (47% TRL 1 to 4) are the least mature (Q17, n=41).
Timing follows readiness, but the extra responses have pushed the first commercial hydrogen shaft furnace a little later. For shaft-furnace DRI on 100% hydrogen, 8% say a plant of at least 1 Mt a year is already operating, 41% expect one by 2028 and an equal 41% in 2029 to 2032, so the group is now evenly split on whether the first full-scale plant arrives this decade or early next (Q18, n=39). Hydrogen DRI plus an electric smelting furnace is expected mostly in 2029 to 2032 (43%) and fluidised-bed reduction mostly in 2033 to 2036 (56%). Hydrogen plasma or smelting reduction (40% after 2040), molten oxide electrolysis (46% after 2040, 14% never) and electrowinning (49% after 2040, 6% never) are not expected at commercial scale before 2040 by most experts. Asked which route will process most low-grade hematite ore into hydrogen-based iron by 2035, 41% chose shaft-furnace DRI on lower-grade pellets followed by an electric smelting furnace and BOF, 23% said low-grade ore will largely not be used for hydrogen-based iron by 2035, 15% chose beneficiation to DR-grade pellets and shaft-furnace DRI-EAF and 10% fluidised-bed reduction of fines (Q19, n=39).
The best-in-class electricity requirement of a hydrogen DRI-EAF plant in 2035, including electrolysis but excluding mining and pelletising, is put at 4.0 MWh per tonne of crude steel (median best estimate; IQR 3.5 to 4.5; individual estimates 2.0 to 6.0; median low 3.3 and median high 5.0), unchanged by the four additional estimates (Q20, n=33). The leading technical barrier to scaling from demonstration to multiple commercial plants is hydrogen supply variability and buffering, with 73% of the maximum Borda score and ranked first by 63%; availability and consistency of DR-grade pellets (29%) and heat balance and gas preheating with hydrogen (26%) follow (Q21, n=41). Among EAF-side challenges, gangue and slag volume from lower-grade DRI is rated most serious (mean 4.3 of 5; median 5), then scrap residuals limiting the product mix (3.5); operating skills and workforce transition is rated least serious (2.5) (Q22, n=36). A second rating of challenges based on public evidence puts hydrogen supply reliability, pressure and purity at the plant boundary first (3.9), then pellet sticking, clustering and fines generation (3.5), electric smelting furnace slag chemistry (3.5) and the behaviour of magnetite or lower-grade ore in fluidised or flash reduction (3.5); DRI reoxidation during handling and transport is rated lowest (2.8) (Q24, n=32).
The data that are hardest to obtain are operating costs and availability of demonstration plants (77%) and realised capex of demonstration and first commercial plants (69%), well ahead of measured energy and hydrogen consumption (38%) and reliability, maintenance and failure data (33%) (Q23, n=39). A first-of-a-kind commercial hydrogen shaft-furnace plant is expected to achieve a 65% capacity factor over its first 24 months (median best estimate; IQR 55 to 70%; median high 80%), although the newer respondents are more pessimistic about the downside, pulling the median low estimate from 50% to 40% (Q25, n=33). Natural gas or methane injection, used pragmatically despite the emissions, is expected by 65% to be the dominant source of carbon added to hydrogen DRI in 2035; 16% expect biochar or other solid biogenic carbon, 14% a mix with no single dominant source and 5% biogenic CO2 or biomethane (Q26, n=43). Where an electric smelting furnace feeds flat, high-quality steel, 41% expect the BOF to take most tonnage by 2035 with smelter hot metal treated like blast-furnace hot metal, 36% expect the EAF with hot metal blended with scrap, and 15% expect a regional split (Q27, n=39). At co-located sites commissioned in 2028 to 2035, 71% expect hot DRI charged directly to the melter with no HBI step and 18% hot-transport-vessel charging with partial cooling (Q28, n=34). Water consumption of a best-in-class plant in 2035, including electrolysis feed water and cooling, is put at 8.7 cubic metres per tonne of crude steel (median best estimate; IQR 3.9 to 13; n=16), a small sample whose spread widened with the three new answers and is now among the most dispersed numeric answers in the elicitation (Q29).
Module 3 · 34 experts
Process flexibility
Hydrogen-ready plants are expected to flex with gas prices and seasons rather than run on hydrogen alone, and flexibility is worth most where power is cheap.
- Minimum stable rate of a hydrogen shaft furnace in 2030: 50 to 70% of nameplate for 35% of experts, 70 to 90% for another 35% Q30, n=20.
- In a least-cost 2035 system, flexibility sits mainly with electrolyser modulation and hydrogen storage, 25 points each of 100 Q32, n=20.
- The most feasible feed flexibility is varying the scrap-to-DRI ratio with market prices, rated 4.5 of 5 Q34, n=21.
- Running mostly on natural gas with hydrogen only when subsidised scores highest for 2035 (56% of maximum); varying the hydrogen share by season or contract is named by 89% Q35, n=27.
- Locational flexibility (49% of maximum) and ore-grade flexibility (45%) matter most for competitiveness Q36, n=28.
Borda score as a share of the maximum (rank 1 = 3 points, rank 3 = 1 point) · share ranking it first.
Borda score as a share of the maximum (rank 1 = 3 points, rank 3 = 1 point) · share ranking it first.
Read the full analysis
Thirty-four experts chose this module, and several questions drew fewer than twenty-five answers, so results here are indicative. The minimum stable production rate a hydrogen shaft furnace will sustain in 2030 without damaging refractories or product quality is put at 50 to 70% of nameplate by 35% and 70 to 90% by another 35%; 15% see no meaningful turndown (Q30, n=20). Moving between 50% and 100% of nameplate is expected to take 6 to 24 hours by 36% and 1 to 6 hours by 32%; 18% say more than 24 hours and 9% under an hour (Q31, n=22).
Asked where flexibility should sit in a least-cost renewable-powered hydrogen DRI system in 2035, the median allocation gave the largest shares to electrolyser modulation (median 25 points; IQR 13.5 to 34.5) and hydrogen storage (25; IQR 10 to 29), which are now exactly level; batteries or other electricity storage (11; IQR 10 to 25), DRI plant load modulation, grid imports or firm power contracts and EAF scheduling (10 each) form a second tier, with DRI/HBI inventory buffering at 7.5 (Q32, n=20). By 2032, experts are evenly split between grid-connected electrolysers running near-continuously and decoupled from on-site renewables (38%) and hydrogen storage between electrolyser and DRI plant (38%) as the more common integration architecture, with 21% expecting battery buffering of electrolyser output; a single expert expects direct coupling with the DRI plant absorbing the variability (Q37, n=24).
On feed, the lowest pellet iron content a hydrogen shaft furnace will use economically by 2030, assuming an electric smelting furnace or adapted EAF downstream, is 62 to 65% Fe for 46% and 65 to 67% Fe for 38% (Q33, n=24). Among feed-flexibility capabilities at commercial scale by 2035, varying the scrap-to-DRI ratio in the EAF with market prices is rated most feasible (mean 4.5 of 5), followed by accepting higher gangue with an electric smelting furnace (3.8), switching pellet suppliers without process changes (3.6), running on magnetite concentrates as well as hematite (3.5) and blending DR-grade and BF-grade pellets (3.5); charging lump ore alongside pellets in a hydrogen shaft furnace is rated least feasible (3.4) (Q34, n=21).
How hydrogen-ready plants will actually use their reductant flexibility in 2035 divided the group, and the extra responses tilted it towards gas. Running mostly on natural gas with hydrogen used only when subsidised now has the highest Borda score (56% of maximum; ranked first by 37%), just ahead of varying the hydrogen share seasonally or by contract period (53%; mentioned by 89%, more than any other). A fixed hydrogen-natural gas blend set by the plant design (37%) has overtaken hydrogen-only operation with natural gas kept for start-up and back-up (31%; first by 22%), which has slipped to fourth (Q35, n=27). Among forms of flexibility that matter for competitiveness, locational flexibility, moving reduction to where power is cheap, still leads on Borda score (49%; first by 36%), with ore grade and feed flexibility close behind (45%; first by 21%, and mentioned by 75%, more than any other) and ahead of hydrogen and natural-gas reductant switching (41%) and electrical load flexibility (32%) (Q36, n=28).
Module 4 · 37 experts
Resources, supply chains and infrastructure
Green iron will be made where firmed renewable power is cheapest and shipped to the steelmaker; DR-grade feed and the size of the merchant market are the open questions.
- Hydrogen-based iron production in 2040: China 20.5%, Middle East and North Africa 15%, Europe 12%, Australia 10% (medians; Q38, n=30).
- Tightest bottlenecks for a first 2 Mt a year export project: the cost of firmed renewable power (named by 74%), finance (62%) and offtake certainty (59%) Q40, n=34.
- Largest corridors in 2040: Middle East and North Africa to Europe (60%), Australia to China (50%), Australia to Japan and Korea (43%) Q43, n=30.
- Merchant hydrogen-based iron traded in 2035: 35 Mt a year (IQR 12.5 to 60), one of the widest spreads Q44, n=24; a liquid HBI market is expected around 2040 Q53, n=22.
- 71% expect beneficiated magnetite pellets to supply most traded green iron in 2035 Q48, n=28; 65% Fe is the feed grade below which a shaft furnace cannot run without further upgrading Q50, n=17.
Box: interquartile range · thick line: median · whiskers: min–max · number: median
Share of respondents selecting each option.
Read the full analysis
Thirty-seven experts chose this module. Allocating global hydrogen-based DRI/HBI production in 2040 across regions, the median expert gave China 20.5% (IQR 15 to 32), the Middle East and North Africa 15% (IQR 10 to 23), Europe 12% (IQR 6.5 to 25), Australia 10% (IQR 7 to 20), Brazil and Latin America 10%, North America 10%, India 6%, Japan, Korea and South-East Asia 5%, Sub-Saharan Africa 5% and other regions 1% (Q38, n=30). China's median edged down with the new responses, and the gap between it and the next region has narrowed. Only 10 to 25% of today's seaborne iron ore trade is seen as economically upgradeable to DR-grade feed by 2035 by 44%; 33% say less than 10% and 22% say 25 to 50%, so more than three in four still put the upgradeable share at a quarter or less (Q39, n=27).
For a first 2 Mt a year green iron export project in a best-in-class location, the ordering of bottlenecks has changed with the seven additional rankings. The cost of firmed renewable electricity is now the tightest bottleneck (50% of maximum Borda; ranked first by 26%; mentioned by 74%), followed by offtake certainty (45%; also first by 26%) and finance and cost of capital (39%; first by 15%; mentioned by 62%), which had led the first cut. Electrolyser cost and delivery (23%), DR-grade ore or beneficiation capacity (19%) and transmission and grid connection (19%) follow; permitting and workforce were not ranked by anyone (Q40, n=34). Public or shared investment is rated most important for high-voltage transmission (mean 4.3 of 5) and hydrogen pipelines and storage (4.3), then water supply and desalination (3.9) and port and HBI handling (3.7); pellet and beneficiation plants (2.8) and workforce housing (2.5) are seen as private matters (Q41, n=26). Roughly three in five agree or strongly agree that most new hydrogen-based iron capacity by 2035 will be built in vertically integrated hubs co-locating ore, renewable electricity, hydrogen and DRI (42% agree, 18% strongly agree, 30% neutral, 9% disagree); the newer respondents were more often neutral than the first group (Q42, n=33).
The corridors expected to carry the largest green iron volumes in 2040 are the Middle East and North Africa to Europe (60%) and Australia to China (50%), then Australia to Japan and Korea (43%) and mostly domestic trade within China (40%), Brazil to Europe (27%) and the Middle East to South and East Asia (23%); Sub-Saharan Africa to Europe and Canada to Europe were not chosen by anyone (Q43, n=30). The volume of merchant hydrogen-based iron traded internationally in 2035 is put at 35 Mt a year (median best estimate; IQR 12.5 to 60; individual estimates from 4 to 300 Mt), still among the most dispersed answers in the elicitation (Q44, n=24). The cost of firmed renewable electricity is the dominant locational driver over the next decade (mean 4.7 of 5; 23 of 32 rated it 5 and nobody below 4), ahead of political and trade risk (4.2), capital and operating subsidies (4.1), carbon pricing and border-adjustment exposure (3.9), access to low-cost natural gas as a bridge (3.8) and proximity to green steel demand (3.6); existing steel plants and skilled workforce matter least (3.0) (Q45, n=32).
On DR-grade feed, the 2030 gap between the pellet demand of operating DRI plants and the supply actually available is put at 25 Mt a year (median best estimate; IQR 16 to 54; n=16, with answers from 0 to 100 Mt and high disagreement) (Q46). If high-grade ore supply grew by an additional 100 Mt a year above 65% Fe by 2030, opinion is now spread fairly evenly: 28% expect modest easing, 24% material easing of DR-grade availability and 24% say the effect depends mainly on beneficiation and pelletising capacity, while 14% expect availability still to tighten and 10% little change; the first cut had leaned towards "depends on beneficiation", and the newer respondents are more optimistic (Q47, n=29). Magnetite beneficiated to DR-grade pellets and fed to shaft-furnace hydrogen DRI is expected by 71% to supply most traded green iron in 2035; 11% expect global green iron trade to stay below 5 Mt a year (Q48, n=28). The probability that more than half of global DRI output in 2035 comes from ore below 65% Fe as mined is put at 40% (median; IQR 22.5 to 57.5%) (Q49, n=27). The feed grade below which a shaft furnace can no longer operate commercially without further upgrading is 65% Fe (median best estimate; IQR 62 to 65; n=17), still the most tightly agreed numeric answer in the elicitation (Q50), and the cost premium for producing DR-grade pellets is USD 35 per tonne of pellets (median; IQR 28.5 to 50; n=18) (Q51).
Among constraints on capacity additions in 2026 to 2032, no single item stands out: electrolyser manufacturing capacity and delivery times (mean 3.6 of 5), high-voltage transformers and grid equipment (3.6) and shaft-furnace and DRI-plant EPC and equipment capacity (3.5) are rated most serious, electric smelting furnace equipment (3.4) close behind; specialist construction labour (3.2) and graphite electrodes (3.0) least (Q52, n=25). A liquid merchant market for hydrogen-based HBI, with multiple independent buyers and sellers trading against a published benchmark, is expected around 2040 (median 50% year 2040; IQR 2037 to 2042; pooled curve crosses 50% in 2040 and 75% in 2045; nobody answered never) (Q53, n=22).
Module 5 · 26 experts
Projects, finance and offtake
The smallest module, with 26 experts: government revenue support is what gets projects to investment decision, and sponsors carry most of the risk today.
- Cost of debt for a first-of-a-kind 2 Mt a year project without government guarantees: 9% a year (IQR 8 to 12.6; Q54, n=12).
- Government offtake or revenue-support contracts are the mechanism most expected to lift projects to investment decision by 2029, ranked first by 62%; buyer-backed offtake usable as collateral is second Q55, n=21.
- In today’s financings the sponsor bears most hydrogen and electricity price risk (60%) and most technology and completion risk (71%) Q56, n=15.
- By 2030 a fixed premium over a benchmark index is the most expected offtake structure; 47% still rank bespoke deals among their top three Q58, n=15.
Borda score as a share of the maximum (rank 1 = 3 points, rank 3 = 1 point) · share ranking it first.
Read the full analysis
Twenty-six experts chose this module, the smallest group, and most questions drew 12 to 21 answers; treat these as indicative. The cost of debt a first-of-a-kind 2 Mt a year hydrogen DRI project with no operating track record would face at final investment decision in 2026 or 2027, without government guarantees, is put at 9% a year (median best estimate; IQR 8 to 12.6; individual estimates 3 to 20%; n=12) (Q54). Government offtake or revenue-support contracts such as carbon contracts for difference are by far the mechanism most expected to increase the number of projects reaching final investment decision by 2029 (76% of maximum Borda; ranked first by 62%; mentioned by 86%). Buyer-backed offtake agreements usable as loan collateral (43%; mentioned by 62%) have moved into second place ahead of direct capital grants or public equity co-investment (33%). Sovereign or strategic-investor equity stakes (17%), export credit, concessional climate finance, development-bank guarantees, insurance and green bonds each scored under 20% (Q55, n=21).
In a typical hydrogen DRI project financing today, the project sponsor or equity is seen as bearing most of the hydrogen and electricity price risk (60%; 27% say it is largely unallocated or uninsurable) and most technology and completion risk (71%; 14% government support scheme). Offtake and demand risk is split between the sponsor (53%) and the buyer via offtake terms (33%). Policy durability risk is spread across the sponsor (47%), government (27%) and unallocated (20%), as is political and cross-border trade risk (40%, 27%, 20%, with 13% on the buyer) (Q56, n=15). Typical 2026 premiums for near-zero or low-emission steel, judged from public assessments, are highest for automotive OEM long-term contracts (46% say USD 120 to 200 per tonne and 31% USD 50 to 120) and lowest for construction and infrastructure (46% no premium, 38% up to USD 50) and the spot market (55% no premium) (Q57, n=13).
By 2030 the most common structure for large green iron and steel offtake agreements is expected to be a fixed premium over a benchmark index for the contract life (53% of maximum Borda; first by 33%), then a government contract for difference covering the gap with the buyer paying the reference price (40%); almost half of experts rank no standard structure, with deals staying bespoke, among their top three (47%), and 27% rank it first, while cost-plus pass-through of the seller's input costs (29%) gained ground with the new responses (Q58, n=15). Of new hydrogen-based DRI capacity reaching operation between 2026 and 2035, experts are now split three ways: 32% expect less than 20% to be brownfield conversions of existing integrated works, 32% expect 20 to 40%, 32% expect 40 to 60% and 5% expect conversion to dominate (Q59, n=19).
Module 6 · 42 experts
Pathways, competitiveness and power systems
Costs converge on the blast furnace only in the late 2030s, the electricity price is the dominant uncertainty, and scrap-based EAF is the one safe investment.
- Carbon price for parity with unabated BF-BOF in Europe in 2030, without subsidies: USD 165 per tonne of CO2 (IQR 141 to 200; Q61, n=30).
- Low-emission hydrogen delivered in 2035: USD 3.0 per kilogram in a best-in-class location (IQR 2.5 to 4.4; Q62, n=34).
- The renewable electricity price and its firming is the largest source of cost uncertainty, ranked first by 58% Q67, n=36.
- Even odds in 2040 that European hydrogen steel undercuts unabated BF-BOF with carbon pricing and CBAM but no subsidies Q68, n=27.
- Scrap-based EAF capacity is the least-regret investment, ranked first by 61% Q72, n=36; a rising, predictable carbon price is the least-regret policy, first by 56% Q75, n=36.
Median low
110.0
Median best
165.0
IQR 141.3–200.0
Median high
232.5
One line per expert (lowest to highest plausible), dot: best estimate, sorted by best estimate · shaded band: interquartile range of best estimates · dashed: median
Unit: USD per tonne CO2
Borda score as a share of the maximum (rank 1 = 3 points, rank 3 = 1 point) · share ranking it first.
Read the full analysis
Forty-two experts chose this module, up from 31 in the previous cut, and the extra answers have sharpened rather than shifted its findings. The domestic cost premium of hydrogen DRI-EAF crude steel over BF-BOF, excluding carbon pricing and subsidies, is put at 25 to 50% in Europe in 2030 by 47% and above 50% by 38%; in Europe in 2035 the centre is still 25 to 50% (44%), with 31% now expecting 10 to 25% and 16% still above 50%. For China the centre is 25 to 50% in 2030 (52%) falling to 10 to 25% in 2035 (45%, with a further 24% at 10% or less) (Q60, n=32). The carbon price that would make hydrogen DRI-EAF steel competitive with unabated BF-BOF in Europe in 2030 without other subsidies is USD 165 per tonne of CO2 (median best estimate; IQR 141 to 200; individual estimates 90 to 250), up from USD 155 in the 84-response cut (Q61, n=30). Low-emission hydrogen delivered to a DRI plant in a best-in-class location in 2035 is expected to cost USD 3.0 per kilogram (median best estimate; IQR 2.5 to 4.4; median low 2.0, median high 4.75). The upper quartile has come down with the extra respondents, but four experts still put their best estimate at USD 8.5 or more, so the spread remains wide (Q62, n=34).
Probabilities for 2030 milestones: China having three or more hydrogen shaft furnaces of 1 Mt a year or larger operating, 70% (median; IQR 50 to 80; n=29); EU CBAM applying to iron and steel at full strength without major derogations, 45% (IQR 25 to 70; n=30); a near-zero steel definition mutually recognised by the EU, Japan and Korea, 45% (n=28); at least 10 Mt a year of hydrogen-based DRI capacity operating globally, 25% (IQR 11.3 to 50; n=34); at least 5 Mt a year of green iron traded between continents, 25% (n=33); a commercial-scale hydrogen DRI plant operating in North America, 20% (IQR 10 to 31.3; n=28) (Q63). Europe is expected to import 10 to 25% of the primary iron units for its near-zero steel as HBI or DRI in 2040 by 39% and 25 to 50% by another 39%; only 6% expect less than 10% and 15% expect more than half (Q64, n=33).
Among power-system issues at multi-million-tonne scale, the cost of firming variable renewables (mean 4.3 of 5), electricity market design and industrial tariffs (4.1) and grid connection lead times (3.9) lead; the value of DRI plants as flexible grid demand (3.0) and DRI plant turndown and ramping (3.0) are rated least important (Q65, n=32). For sustaining hydrogen-based steelmaking after 2030, domestic carbon pricing (4.1), border carbon adjustment (4.1) and carbon contracts for difference (4.0) are rated most effective; plurilateral clubs and sectoral agreements score lowest (3.2) (Q66, n=33). The parameter contributing most to uncertainty in the 2035 cost of hydrogen-based steel is the renewable electricity price and firming (71% of maximum Borda; ranked first by 58%; mentioned by 81%), far ahead of the green premium buyers will pay (29%), carbon price and CBAM (26%) and electrolyser capex and efficiency (21%); the green premium has moved up to second place with the extra respondents, but the three are close and all far behind electricity (Q67, n=36). Hydrogen DRI-EAF steel made in Europe becoming cheaper than unabated BF-BOF steel in Europe, including carbon pricing and border adjustment but excluding subsidies, is given even odds in 2040 (median 50% year; IQR 2036.5 to 2043); the pooled curve crosses 25% in 2035, 50% in 2040 and 75% in 2046 (Q68, n=27).
Global crude steel demand in 2050 is put at 2,025 Mt a year (median best estimate; IQR 1,905 to 2,200; individual estimates 1,200 to 2,600), still the second most tightly agreed numeric answer in the elicitation (Q69, n=30). The delivered price of firmed, near-continuous renewable electricity for a large flexible industrial user in 2030 is expected to be below USD 30 per MWh in China by 43%, with another 38% in the 30 to 50 band; the 30 to 50 band is also the centre for the Middle East and North Africa (45%) and the United States (47%), while Europe is split between 30 to 50 (38%) and 50 or above (52%, with 24% at 70 to 100) (Q70, n=24). Iron and steel is expected to account for 11% of global hydrogen consumption in 2035 (median best estimate; IQR 10 to 18.5) (Q71, n=24).
Three least-regret questions close the module. For a steelmaker deciding today, scrap-based EAF capacity and scrap sourcing is the clear least-regret investment (75% of maximum Borda; first by 61%; mentioned by 89%). Behind it, grid connection and long-term renewable power contracts (26%; mentioned by 44%) and hydrogen-ready DRI started on natural gas (25%) are now almost level, ahead of long-term green-steel offtake contracts (23%); deferring major capital decisions until after 2030 was ranked by 17% and first by one expert (Q72, n=36). For an integrated BF-BOF site in a high-cost jurisdiction facing a reline before 2032, the most common first answer is that it depends entirely on the site (first by 58%), but the most widely mentioned option is to replace the furnace with an EAF fed by scrap and imported HBI (mentioned by 82%; Borda 52%; first by 15%), ahead of hydrogen-ready natural-gas DRI and EAF (24%) and retiring the capacity to source slab or iron elsewhere (23%); relining unabated and deciding later was ranked by 33% but first by only 6% (Q73, n=33). If renewable hydrogen still costs more than USD 4 per kilogram in 2035, scrap-based EAF expansion is judged robust by 85% and at risk by nobody; natural-gas DRI with CCS is robust for 35% and tolerable for another 38%; importing green HBI is tolerable for 63%; hydrogen DRI at the existing steel site is tolerable for 46% and at risk for 46%; the electric smelter on lower-grade ore with hydrogen DRI is at risk for 36%; and the blast furnace with CCUS is at risk of stranding for 58% (Q74, n=28). Among least-regret policies, a rising, predictable carbon price dominates (65% of maximum Borda; first by 56%; mentioned by 72%), then lead markets (29%), grid build-out and faster connection for industrial loads (26%) and border carbon adjustment (24%); research and demonstration funding was ranked by one expert (Q75, n=36).
Module 7 · 42 experts
Regional pathways
China stays on the blast furnace to 2035, the United States turns to gas DRI, and Japan, Korea and Europe increasingly import their iron units.
- China in 2035: 62% unabated BF-BOF, 22% scrap EAF, 9% hydrogen DRI (medians; Q76, n=28); whether China becomes a net exporter or importer of hydrogen-based iron is evenly split Q77, n=31.
- India in 2035: 52% expect coal-based rotary-kiln DRI to remain the dominant direct-reduction route Q78, n=27.
- United States 2025 to 2035: half expect natural-gas DRI-EAF without CCS to lead new primary capacity; nobody expects hydrogen DRI Q79, n=24.
- About half of the EU blast-furnace capacity facing a reinvestment decision by 2030 is expected to close permanently by 2035 (median 49%; Q80, n=25).
- Imported share of primary iron units for near-zero steel by 2050: Japan 65%, South Korea 60%, European Union 50% (medians; Q82, n=32).
Box: interquartile range · thick line: median · whiskers: min–max · number: median
Dot: median · bar: interquartile range
Read the full analysis
Forty-two experts chose this module, with 24 to 33 answering each question. For China's domestic crude steel in 2035, the median allocation is 62% unabated BF-BOF (IQR 50 to 70), 22% scrap-based EAF (IQR 15.8 to 28.5), 9% hydrogen-based DRI-EAF (IQR 3 to 10), 5% BF-BOF with CCUS and about 1% each for natural-gas DRI-EAF and novel routes; the hydrogen share has slipped from 10% in the previous cut as the newer respondents are more cautious (Q76, n=28). Whether China will be a net exporter or importer of hydrogen-based DRI and HBI in 2035 is finely balanced: 35% expect a modest net exporter, 26% a modest net importer, 16% negligible trade either way and 16% roughly balanced; one expert expects a significant net exporter above 5 Mt a year and one a significant net importer (Q77, n=31).
In India, 52% expect coal-based rotary-kiln DRI to remain the dominant direct-reduction pathway in 2035 and 30% expect BF-BOF expansion to outpace all DRI routes; 11% expect hydrogen-based DRI to dominate new capacity and 7% natural-gas DRI (Q78, n=27). In the United States, a clearer picture has emerged with the larger sample: half of the experts now expect natural-gas DRI-EAF without CCS to account for most new primary ironmaking capacity between 2025 and 2035 (50%), against 29% who expect scrap-EAF to absorb nearly all growth with little new primary capacity and 21% who expect gas DRI with CCS; nobody expects hydrogen DRI or new unabated BF-BOF (Q79, n=24). Of the EU blast-furnace capacity that needs a reinvestment decision by 2030, about half (median best estimate 49%; IQR 25 to 55) is expected to be permanently closed by 2035 with no low-emission replacement on the same site, with the lower quartile falling as more experts put the figure in the 20s (Q80, n=25).
Import dependence for near-zero steel rises over time in the importing regions. By 2035 the median expected share of primary iron units imported as HBI or DRI rather than reduced domestically is 45% for Japan (IQR 10 to 62.5), 35% for South Korea (IQR 5 to 65), 25% for the European Union (IQR 20 to 45), 5% for China and 5% for India (Q81, n=33). By 2050 it is 65% for Japan (IQR 50 to 80), 60% for South Korea (IQR 32.5 to 70), 50% for the European Union (IQR 45 to 60), 10% for China and 10% for India (Q82, n=32). The 2050 answers cluster more tightly than the 2035 ones, and the gap between the two horizons has widened slightly for Europe and Japan with the extra respondents.
Module 8 · 81 experts
Markets, standards and policy
Buyers will pay a modest premium, automotive moves first, and a shared carbon-accounting rulebook is the gap that most limits decisions.
- Premium buyers will sustainably pay for near-zero steel in 2030: USD 50 to 100 per tonne for 35%, up to USD 50 for 32%, none for 9% Q83, n=66.
- Automotive is the only sector most experts expect to move fast by 2035 (56%); construction lags, with 60% expecting slow progress Q84, n=68.
- Carbon accounting and certification rules are the top knowledge gap, 3.9 of 5 Q85, n=63; every accounting safeguard is rated above 4 of 5, mutual recognition across borders at 4.3 Q86, n=67.
- One mutually recognised steel carbon-intensity standard: even odds around 2038 on the pooled curve Q87, n=62.
- The policy most at risk of being weakened by 2030 is the EU ETS free-allocation phase-out timetable, ranked first by 48% Q88, n=52.
Mean score 76.5, median 75.0
Read the full analysis
Eighty-one experts chose this module, the largest expertise group, and its results are the most stable in the report: no ranking of substance has changed. The premium buyers will sustainably pay for near-zero emission steel in 2030, averaged across segments, is USD 50 to 100 per tonne for 35%, up to USD 50 for 32%, USD 100 to 200 for 18%, no premium for 9% and more than USD 200 for 6% (Q83, n=66). By 2035, automotive is expected to have made rapid progress (40%) or largely transitioned (16%) by a majority; wind, solar and grid equipment follows (36% rapid, 9% largely). Construction and infrastructure (60% slow progress, 22% pilots only), shipbuilding (37% slow, 29% pilots), machinery (44% slow, 27% pilots) and appliances (44% slow) are expected to lag (Q84, n=68).
The knowledge gaps that most limit decisions by industry and governments today are carbon accounting and certification rules (mean 3.9 of 5), comparison of national policy packages (3.6), power-system integration assessment (3.5), plant flexibility and hydrogen buffering requirements (3.5), operating data from demonstration plants (3.5), trade and relocation scenarios (3.5), a comparative supply-chain cost model (3.5) and processing routes for low-grade ores (3.5); workforce and skills requirements limit least (2.8) (Q85, n=63). Every safeguard for emissions-accounting schemes is rated important: transparent eligibility and boundary rules (4.4), prevention of double counting (4.4), mutual recognition between schemes across borders (4.3), public disclosure of the allocation method (4.3), physical traceability or chain of custody (4.2) and independent third-party verification (4.2) (Q86, n=67). A single steel carbon-intensity standard mutually recognised across the EU, Japan, Korea, the United States, India and China is given even odds around 2040 (median 50% year 2040; IQR 2035 to 2047.5; the pooled curve crosses 50% in 2038); four experts answered never for the 50% year and twelve for the 90% year, so the tail of doubt has lengthened with the extra respondents (Q87, n=62).
The policy instrument most likely to be materially weakened, delayed or reversed by 2030 is the EU ETS free-allocation phase-out timetable for 2026 to 2034 (60% of maximum Borda; ranked first by 48%), followed by the EU CBAM extension to downstream products (35%) and the US Section 232 steel tariffs at 50% (35%), which swapped places in the previous cut and are now level to the nearest percentage point; India's green steel procurement mandate (16%) and Germany's carbon contracts for difference (14%) follow (Q88, n=52). On CBAM treating imported DRI and HBI as reportable precursors on verified actual emissions, 47% expect a roughly neutral effect on imported hydrogen-based iron versus EU-produced hydrogen DRI by 2030, 19% say it is too uncertain, 19% expect it to materially favour EU production because the compliance burden is a real barrier and 15% expect it to favour verified low-carbon imports (Q89, n=53).
Carbon contracts for difference are most effective when they cover both the carbon-price gap and the hydrogen or electricity cost gap (76%), run for ten years or more (61%), are combined with demand-side measures such as lead markets or quotas (52%) and sit on a predictable carbon price and free-allocation phase-out path (44%); fast award with limited conditionality was chosen by one expert (Q90, n=54). The EU's hourly renewable-matching requirement for RFNBO hydrogen, if it takes effect as legislated, is expected to raise the delivered cost of hydrogen at a typical European site in 2032 by 20% compared with annual matching (median best estimate; IQR 16 to 35) (Q91, n=21). China's national ETS, which steel entered in 2025 with intensity-based free allocation, is expected to deliver a modest reduction in sector emissions by 2030, mainly through efficiency gains with little route switching, by 52%; 20% say it is too early to judge, 20% expect a negligible effect and 8% a material reduction (Q92, n=50).
Asked what requirements will apply by 2040 when an existing blast furnace seeks permission to reline, experts expect the European Union to prohibit relining of unabated furnaces (51%) or to require abatement (33%). For China the modal answer is an emissions-reduction plan (46%) with 33% expecting abatement; for Japan abatement (47%) or an emissions-reduction plan (40%); for Korea similar (43% and 39%, with 13% prohibition). For India (47% no specific climate requirement, 47% a plan) and the United States (36% and 40%, with 13% for abatement and 11% for prohibition) few expect abatement to be required (Q93, n=55).
Synthesis
Where experts agree and disagree
Dispersion scores each question from 0, where every expert agreed, to 1, where answers spread across the whole range. The ten most agreed and ten most contested questions are listed below.
Most agreed
Lowest dispersion · score 0 (unanimous) to 1
- Q50 For feed charged to a shaft furnace as DR pellets or lump ore, below what Fe grade of that feed can the plant… n=17 0.05
- Q69 What will global crude steel demand be in 2050, all routes and regions? n=30 0.15
- Q8 Allocate global crude steel production in 2040 across production routes (percent, summing to 100). n=88 0.17
- Q76 Allocate China's domestic crude steel production in 2035 across production routes (percent, summing to 100). n=28 0.18
- Q38 Allocate global hydrogen-based DRI/HBI production in 2040 across producing regions (percent, summing to 100). n=30 0.20
- Q82 And by 2050, what share of each region's primary iron units for near-zero steel will be imported as HBI or DR… n=32 0.23
- Q25 For a representative first-of-a-kind commercial-scale hydrogen shaft-furnace DRI plant, what capacity factor … n=33 0.23
- Q20 What total electricity input per tonne of crude steel will a best-in-class hydrogen-based DRI-EAF plant need … n=33 0.25
- Q86 How important is each safeguard for emissions-accounting schemes covering near-zero and low-emission steel? n=67 0.25
- Q24 Based on publicly available evidence, how important is each technical challenge for scaling hydrogen-based DR… n=32 0.27
Most contested
Highest dispersion · score 0 (unanimous) to 1
- Q13 What share of global hydrogen-based DRI/HBI output will be traded internationally as merchant iron in 2040, r… n=71 1.00
- Q44 How much hydrogen-based merchant iron (DRI/HBI) will be traded internationally in 2035? n=24 1.00
- Q29 What will total water consumption be for a best-in-class hydrogen-based DRI-EAF plant in 2035, including elec… n=16 1.00
- Q46 In 2030, what will be the gap between the DR-grade pellet demand of DRI plants then in commercial operation a… n=16 1.00
- Q87 By what year, if ever, will one steel product carbon-intensity standard, with shared definitions, system boun… n=62 1.00
- Q35 How will most hydrogen-ready DRI plants use their reductant flexibility in 2035? Rank the three most likely m… n=27 0.97
- Q58 By 2030, which contract structure will be most common for large-volume green iron and steel offtake agreement… n=15 0.97
- Q47 If global high-grade ore supply grew substantially by 2030 (say an additional 100 Mt per year of ore above 65… n=29 0.96
- Q12 Rank the three policy instruments that would most accelerate hydrogen-based ironmaking deployment over the ne… n=92 0.95
- Q91 If the EU's hourly renewable-matching requirement for RFNBO hydrogen takes effect as legislated, by what perc… n=21 0.95
Read the full analysis
Each question was scored for dispersion on a 0 to 1 scale: normalised entropy of the shares for choice and ranking questions, and the interquartile range relative to the scale (ratings, probabilities, allocations), to the median (quantities) or to ten years (year questions). The profile questions are excluded. Because the two families of questions are scored differently, the most agreed questions are mostly numeric and the most contested are mostly choices and rankings, so the two lists should be read within each family rather than against each other.
The ten most tightly clustered answers are: the shaft-furnace feed grade below which a plant cannot operate commercially, 65% Fe (Q50; dispersion 0.05); global crude steel demand in 2050, 2,025 Mt (Q69; 0.15); the global 2040 route mix (Q8; 0.17); China's 2035 route mix (Q76; 0.18); the regional allocation of 2040 hydrogen-based iron production (Q38; 0.20); 2050 import shares for near-zero steel by region (Q82; 0.23); the first-two-year capacity factor of a first-of-a-kind plant, 65% (Q25; 0.23); electricity input per tonne of crude steel, 4.0 MWh (Q20; 0.25); the importance of safeguards for emissions-accounting schemes (Q86; 0.25); and the importance of the technical challenges for scaling hydrogen-based DRI (Q24; 0.27). The ratings questions in this list agree because experts rate nearly everything as important; the numeric ones agree in substance. With the final 16 responses the importance of public investment in hub infrastructure (Q41) dropped out of the list, as the larger supply-chain group spread its ratings more widely, and the accounting safeguards took its place.
The ten most contested answers are: the share of hydrogen-based iron traded internationally in 2040 (Q13; dispersion 1.00), the volume of merchant iron traded in 2035 (Q44; 1.00), the water consumption of a best-in-class plant in 2035 (Q29; 1.00) and the 2030 DR-grade pellet gap (Q46; 1.00), all with interquartile ranges as wide as their medians, together with the year by which a single mutually recognised steel carbon-intensity standard will exist, whose middle half spans more than a decade (Q87; 1.00); how hydrogen-ready plants will use reductant flexibility (Q35; 0.97); the most common offtake contract structure in 2030 (Q58; 0.97); the effect of 100 Mt of extra high-grade ore on DR-grade availability (Q47; 0.96); the policy accelerators (Q12; 0.95); and the cost penalty of hourly renewable matching for RFNBO hydrogen (Q91; 0.95). The common thread is trade, inputs, commercial structure and the rules of the game: experts broadly agree on technology and on the shape of the route mix, and disagree on how much iron will move across borders, how much water and pellet feed the first plants will need, under what contracts projects will sell, and when the accounting rules will settle. The delivered cost of hydrogen in 2035 (Q62), among the most contested questions in the earlier cut, left the list as the final responses narrowed its interquartile range from USD 2.5 to 5.5 per kilogram to USD 2.5 to 4.4; the most useful Task 52 outputs (Q7) and the reline decision (Q73) sit just below the cut at 0.95 and 0.93.
Breakdowns by Task 52 affiliation
Subtask A experts put energy-price risk first among barriers to investment while every other group puts offtake first; the industry group is the most sure that new DRI projects will start on natural gas; and the technology group is the most willing to count upstream emissions in the definition of near-zero steel.
- Subtask A
- 27
- Subtask B
- 16
- Subtask C
- 19
- Linkage and exchange
- 12
- Industry and policy reference
- 21
- Not yet assigned
- 8
Per-question results were also computed for each Task 52 affiliation group with at least five answers (Subtask A, Subtask B, Subtask C, Task linkage and exchange, industry or policy reference experts, and not yet assigned). Most expertise-module questions only reach that threshold for Subtask A and the industry group, although the markets module now clears it for every group, and several of the differences below rest on groups of five to ten experts, so they are leads for discussion rather than findings.
On timing and cost the groups are close. The pooled 50% year for 10 Mt a year of hydrogen DRI capacity is 2036 for Subtask C (n=15), 2037 for Subtask A (n=25), Subtask B (n=16) and the linkage group (n=11) and 2040 for the industry group (n=15) (Q9). The 2040 route-mix medians differ by a few points at most, with the linkage group and Subtask B giving hydrogen DRI-EAF the highest median shares, 11% (n=11) and 10% (n=15), against 5 to 6% elsewhere (Q8). Subtask C is the most optimistic on the 2035 cost premium, with 62% of its members expecting 10 to 25% (n=16), and Subtask A on 2040, where half expect a 0 to 10% premium (n=22); the industry group still centres on 10 to 50% in 2040, with only 23% expecting 10% or less (n=13) (Q10).
Barriers and policy diverge by vantage point. Subtask A puts hydrogen or electricity price risk first as the barrier to final investment decision (71% of maximum Borda, n=26), while Subtask C (70%, n=18), the industry group (67%, n=20), Subtask B (60%, n=16) and the unassigned group (86%, n=7) put offtake and green-premium uncertainty first (Q11). As accelerators, Subtask B is split between border carbon adjustment and domestic carbon pricing (38% and 33%, n=15), Subtask A between capital grants and lead markets (38% each, n=22), while the industry group leans to lead markets (38%) over capital grants (33%, n=20); Subtask C (42%, n=16) and the linkage group (42%, n=12) put lead markets first, and the unassigned group hydrogen production tax credits (38%, n=7) (Q12). On the definition boundary, 74% of Subtask A want upstream Scope 3 included (n=23), against 50% of Subtask B (n=16) and 42% of the industry group (n=19), where Scope 1 and 2 only draws 38% and 37% (Q15). The industry group largely agrees that commercial DRI projects will start on natural gas (78%, n=18); Subtask B is split evenly between gas-first and a regional mix (47% each, n=15) (Q16).
Within the technology module, industry reference experts rate shaft-furnace DRI on 100% hydrogen less mature than Subtask A does (36% TRL 5 to 6, n=11, against 14% in Subtask A, n=22, with 9% and 14% at TRL 9) (Q17), yet expect the first 1 Mt plant sooner (20% already operating and 50% by 2028, n=10, whereas 55% of Subtask A say 2029 to 2032, n=20) (Q18). Subtask A ranks ore grade and feed flexibility as the most valuable form of flexibility (58%, n=16) while the industry group ranks reductant switching and locational flexibility jointly first (63% each, n=8) (Q36), and Subtask A expects seasonal variation of the hydrogen share to be the most common operating mode (57%, n=17) while the industry group expects plants to run mostly on gas with hydrogen when subsidised (67%, n=7) (Q35).
In the markets module, Subtask B (42%, n=12), Subtask A (41%, n=17) and the linkage group (60%, n=10) centre the 2030 premium on USD 50 to 100 per tonne, Subtask C leans towards up to USD 50 (56%, n=9), and the industry group is the most dispersed, leaning towards up to USD 50 (43%) with 14% expecting no premium and 14% more than USD 200 (n=14) (Q83). On CBAM's treatment of imported iron, 38% of Subtask B (n=8) and 33% of Subtask A (n=12) expect it to favour EU production, 67% of the industry group expect a neutral effect (n=15), 33% of the linkage group expect it to favour verified low-carbon imports (n=9) and 43% of Subtask C call it too uncertain (n=7) (Q89). Forty per cent of the industry group expects China's ETS to have a negligible effect on emissions by 2030 (n=10), whereas 64% of Subtask B (n=11) and 86% of the linkage group (n=7) expect a modest reduction (Q92). Subtask B ranks the EU CBAM extension to downstream products as the policy most likely to be weakened (48%, n=11) while every other group puts the EU ETS free-allocation phase-out first, most strongly the industry group (79%, n=13), the linkage group (78%, n=9) and Subtask C (70%, n=9) (Q88).
Preferences for Task 52 outputs follow the Subtask remits: 75% of Subtask B want the supply-chain route and cost comparison tool (n=16), 56% of Subtask A the technology readiness atlas (n=27), 58% of Subtask C the open techno-economic database and 47% the comparison of global scenario studies (n=19), and the industry group the scenario comparison (43%) and the policy brief series (38%, n=21) (Q7).
For the Task
What this means for Task 52
- 1
Build the open techno-economic database and the readiness atlas around realised capex, operating cost, availability and capacity-factor evidence from demonstration and first commercial plants: experts chose the database first (57%; Q7, n=104) and find exactly these data hardest to obtain Q23, n=39.
- 2
Keep merchant iron and integrated on-site steelmaking apart in every cost comparison; experts regard their costs and risks as different.
- 3
Concentrate the markets and policy work on accounting safeguards and mutual recognition, the gap that most limits decisions today Q85, n=63 and one not expected to close before about 2040 Q87, n=62.
- 4
Test the network’s central expectations, 6% hydrogen DRI and 42% unabated BF-BOF in 2040, against published scenarios in the Subtask C comparison and explain any gap.
- 5
Validate the finance results with lenders and project developers: that module drew 26 experts and nobody from finance or investment.
- 6
Run a second, structured round with feedback on the most contested topics: trade volumes, the DR-grade pellet gap, plant water use and the timing of a carbon-intensity standard.
Read the full text
The outputs experts asked for match the gaps they identified. An open techno-economic database of routes was chosen by 57% of all respondents, a comparison of global scenario studies and a supply-chain route and cost comparison tool by 38% each, a technology readiness atlas by 37% and a global project tracker by 36% (Q7, n=104). The data experts find hardest to obtain are operating costs and availability of demonstration plants (77%) and realised capex of first plants (69%) (Q23), and the knowledge gap that most limits decisions is carbon accounting and certification rules (Q85). Three actions follow. First, the techno-economic database and readiness atlas should prioritise realised capex, operating cost, availability and capacity-factor evidence from demonstration and first commercial plants, including the 65% first-two-year capacity factor and 4.0 MWh per tonne benchmarks elicited here, and should separate merchant iron from integrated on-site steelmaking, whose costs and risks experts regard as different. Second, the markets and policy work should concentrate on accounting safeguards and mutual recognition, where every safeguard was rated above 4 of 5 and a recognised standard is not expected before about 2040. Third, the Subtask C scenario comparison should test the network's central expectations, a 6% hydrogen DRI share and 42% unabated BF-BOF in 2040, against published pathways and explain the gap.
The elicitation also tells the Task where its own evidence is thin. The finance module drew 26 experts and no respondent came from finance or investment, so the cost-of-debt and risk-allocation results need validation with lenders and project developers. Nobody named Sub-Saharan Africa as a region of expertise, and Türkiye, the Middle East and North Africa were raised as regional pathways to add. The most contested results, on trade volumes, the DR-grade pellet gap, plant water consumption and the timing of a single carbon-intensity standard, are where a second, structured round with feedback would most reduce uncertainty; the delivered cost of hydrogen, equally contested in the earlier cut, tightened as the sample grew, which suggests that some of the remaining spread is small-sample noise rather than settled disagreement.
For the Oxford panels and the COP31 launch, the results give each panel a quantified starting point: technology readiness and process integration (Q17 to Q29), global value chains, bankability and resources (Q38 to Q59), enabling projects through supply chains, infrastructure and policy (Q60 to Q75) and enabling markets through accounting, procurement and standards (Q83 to Q93). The free-text questions experts submitted for those panels have been summarised separately for the Task leadership.
How the elicitation was run and its limits
Task 52 (Hydrogen for Iron and Steelmaking) is a Task of the IEA Hydrogen Technology Collaboration Programme. Its expert network spans technology assessment (Subtask A), resources, supply chains and infrastructure (Subtask B), global pathways, competitiveness and power systems (Subtask C), a linkage group that contributes across Subtasks, and industry and policy reference experts.
The elicitation was a structured online questionnaire of 93 questions in nine modules, built from the question bank version 2026-09-oxford-v4 after two rounds of review by the Task leadership. Two modules were core and answered by everyone: a profile module (7 questions, including which Task 52 outputs the expert would find most useful) and a cross-cutting outlook module (9 questions on the 2040 route mix, timing, costs, barriers, policy and definitions). Seven expertise modules were self-selected: technology readiness and process integration (13 questions), process flexibility (8), resources, supply chains and infrastructure (16), projects, finance and offtake (6), pathways, competitiveness and power systems (16), regional pathways (7) and markets, standards and policy (11).
Question formats were chosen to make uncertainty explicit. Quantities were asked as a low, high and best estimate; years as the year by which the expert sees a 10%, 50% and 90% chance; preferences as ranked top-three lists, point allocations summing to 100, probability sliders, choice grids and five-point ratings. A one-minute calibration warm-up on two known quantities (world crude steel production in 2024 and world DRI production in 2023) preceded the modules. Experts could save a draft under a resume code and return later.
The questionnaire opened on 12 September 2026 and was circulated to the Task 52 expert network ahead of the Oxford workshop on the economic competitiveness of hydrogen-based iron and steelmaking (University of Oxford, 25 September 2026). The nominal closing date was 24 September 2026; the questionnaire was then reopened until Friday 30 October 2026 so that the pooled results can feed the Task 52 annual report, and a few responses that arrived in the days after the closing date were accepted. This report uses all responses received up to 8 November 2026. It was a single round with no group feedback: experts did not see each other's answers, so the spread in every result is genuine disagreement rather than a converged consensus. This report covers 104 responses, one per expert (the latest submission per email address), with data as of 8 November 2026. The pooled results from the first round (74 responses) were presented at the Oxford workshop, where they framed the four panel discussions; an interim cut of 84 responses was used to prepare this report, and the full set of 104 will be launched publicly at COP31.
The expert base in detail
One hundred and four experts submitted a response. Of the 103 who stated an affiliation within the Task, 26% are most closely associated with Subtask A (technology assessment and readiness), 16% with Subtask B (resources, supply chains and infrastructure), 18% with Subtask C (global pathways, competitiveness and power systems), 12% with Task linkage and exchange, 20% are industry or policy reference experts and 8% are not yet assigned (Q1, n=103).
By sector, universities and research institutes supplied 40% of respondents, NGOs, think tanks and industry associations 15%, technology providers, EPC and equipment companies 10%, intergovernmental organisations 10%, iron and steel producers 8%, consultancies 7%, mining and ore suppliers 4%, energy, hydrogen and utility companies 4% and government agencies 4%. The latest responses came from intergovernmental organisations, an NGO or think tank and a government agency; no respondent came from finance or investment (Q3, n=103).
Experts could name up to three regions of expertise. Europe was named by 49%, a global or non-specific focus by 31%, Australia and New Zealand by 23%, China by 21%, India and South-East Asia by 14%, Japan and South Korea by 11%, the Middle East and North Africa by 10%, Brazil and Latin America by 9% and North America by 7%. Nobody named Sub-Saharan Africa (Q4, n=103). Australian expertise is better represented than in the earlier cut, reflecting where a large share of the final-week responses came from. Professional backgrounds (up to two each) were led by economists and techno-economic modellers (32%), policy or regulatory analysts (26%), metallurgists and materials scientists (24%), chemical and process engineers (19%) and business, strategy and finance professionals (17%) (Q2, n=103). Experience is split between newer and long-standing specialists: 36% of respondents have worked on iron and steel for 3 to 6 years and 20% for less than 3 years, while 28% have more than 15 years and 16% have 7 to 15 years (Q5, n=102).
Self-rated expertise on a five-point scale was highest for ironmaking and steelmaking process technology (mean 3.5, median 4), followed by techno-economics, markets and trade (3.4, median 3), renewable electricity, hydrogen production and power systems (3.3, median 3), policy, standards, certification and finance (3.1), supply chains, logistics and infrastructure (2.8) and iron ore quality, beneficiation and pelletising (2.7) (Q6, n=102). The two calibration items were answered by 97 and 93 experts; the stated low-to-high ranges contained the true value 71% of the time for world crude steel production and 63% of the time for world DRI production, better than the roughly 50% hit rate the warm-up warned of, but below the 80% a well-calibrated range should reach.
Module uptake reflects the network's centre of gravity. Beyond the two core modules (104 each), markets, standards and policy drew 81 experts, technology readiness 47, regional pathways 42, pathways and power systems 42, supply chains 37, process flexibility 34 and projects and finance 26. The median expert answered five modules including the two core ones, and 36 questions (IQR 25 to 50; range 7 to 93); seven experts answered all nine modules. The median time between starting and submitting was 62 minutes, with a quarter finishing in under 41 minutes and a long tail of sessions saved and resumed over days or weeks. Asked at the end how confident they were overall, 78 experts rated their 2030 answers (65% moderate, 28% high, 6% low) and 65 rated their 2035 to 2040 answers (65% moderate, 31% low, 5% high). Thirty-two experts left 87 free-text comments for the Oxford panels; these were used to shape the panel discussions and are not reproduced.
Methodology and limitations
Central values are medians and spread is the interquartile range, the middle half of the answers; charts and tables also show the full range where it is informative. For four-value questions the statistics are of the best estimates, with the medians of the low and high bounds reported alongside. Choice questions report the share of experts choosing each option; multiple-choice questions report the share selecting each option, so shares sum to more than 100%. Ranking questions use a Borda count in which a first place scores three points, second two and third one; the Borda share is the score as a fraction of the maximum possible, and the share ranking an option first and the share mentioning it anywhere in the top three are also reported. Allocation questions report the median and interquartile range of the points given to each option, so medians need not sum to 100. Ratings report the mean, median and interquartile range of the one-to-five scores, with rows marked not my expertise omitted. Year questions pool cumulative curves: each expert gives the year by which they see a 10%, 50% and 90% chance, and the pooled curve is the average of their piecewise-linear cumulative distributions, with never treated as beyond the horizon. Agreement is scored by normalised entropy for choices and rankings and by relative interquartile range for numeric, probability, allocation and year questions.
The sample is the Task 52 expert network, not a random sample of the industry. Expertise modules were self-selected, so each result rests on a different and often small group: 26 experts in finance, 34 in flexibility, 37 in supply chains, 42 in pathways, 42 in regional pathways, 47 in technology and 81 in markets, and individual questions within those modules can rest on fewer than a dozen answers where experts skipped a question or marked it outside their expertise. Every result in this report and its appendix states its n. Academia supplied two in five respondents, Europe was the most cited region of expertise and no respondent came from finance. It was a single round with no group feedback, so the results show where independent judgements fall, not a negotiated consensus. The calibration warm-up found that stated ranges contained the true value 71% and 63% of the time on two known quantities, so the low-to-high ranges in the four-value questions are probably somewhat narrower than they should be. Estimates are judgements about an uncertain future made between September and early November 2026, not measurements.
The questionnaire closed on 30 October 2026. This report covers 104 responses, one per expert (the latest submission per email address), with data as of 8 November 2026; a small number of responses that arrived in the days after the closing date were accepted and are included. Anonymity rules were set before the elicitation opened. Names, organisations, email addresses and free-text comments never enter the published dataset; only aggregates are released. Breakdowns by Task 52 affiliation are shown only where a group has at least five answers to the question, and no other breakdowns are published. Experts were told their responses were confidential rather than anonymous, and that pooled findings would be shared with the network and the public.
Question bank 2026-09-oxford-v4. Data as of 8 November 2026. No individual expert, organisation or free-text comment is identifiable; breakdowns by Task 52 affiliation are shown only for groups of five or more.
Global Steel Transition Atlas
The map behind the expectations
The Atlas was launched alongside this report. It is an open, interactive map of where steel is made, where the ore is, how iron moves, where the emissions are, where green hydrogen will be cheapest and where the green projects are. Five views are shown here as they stood on 11 November 2026; the figures move as the underlying trackers update.
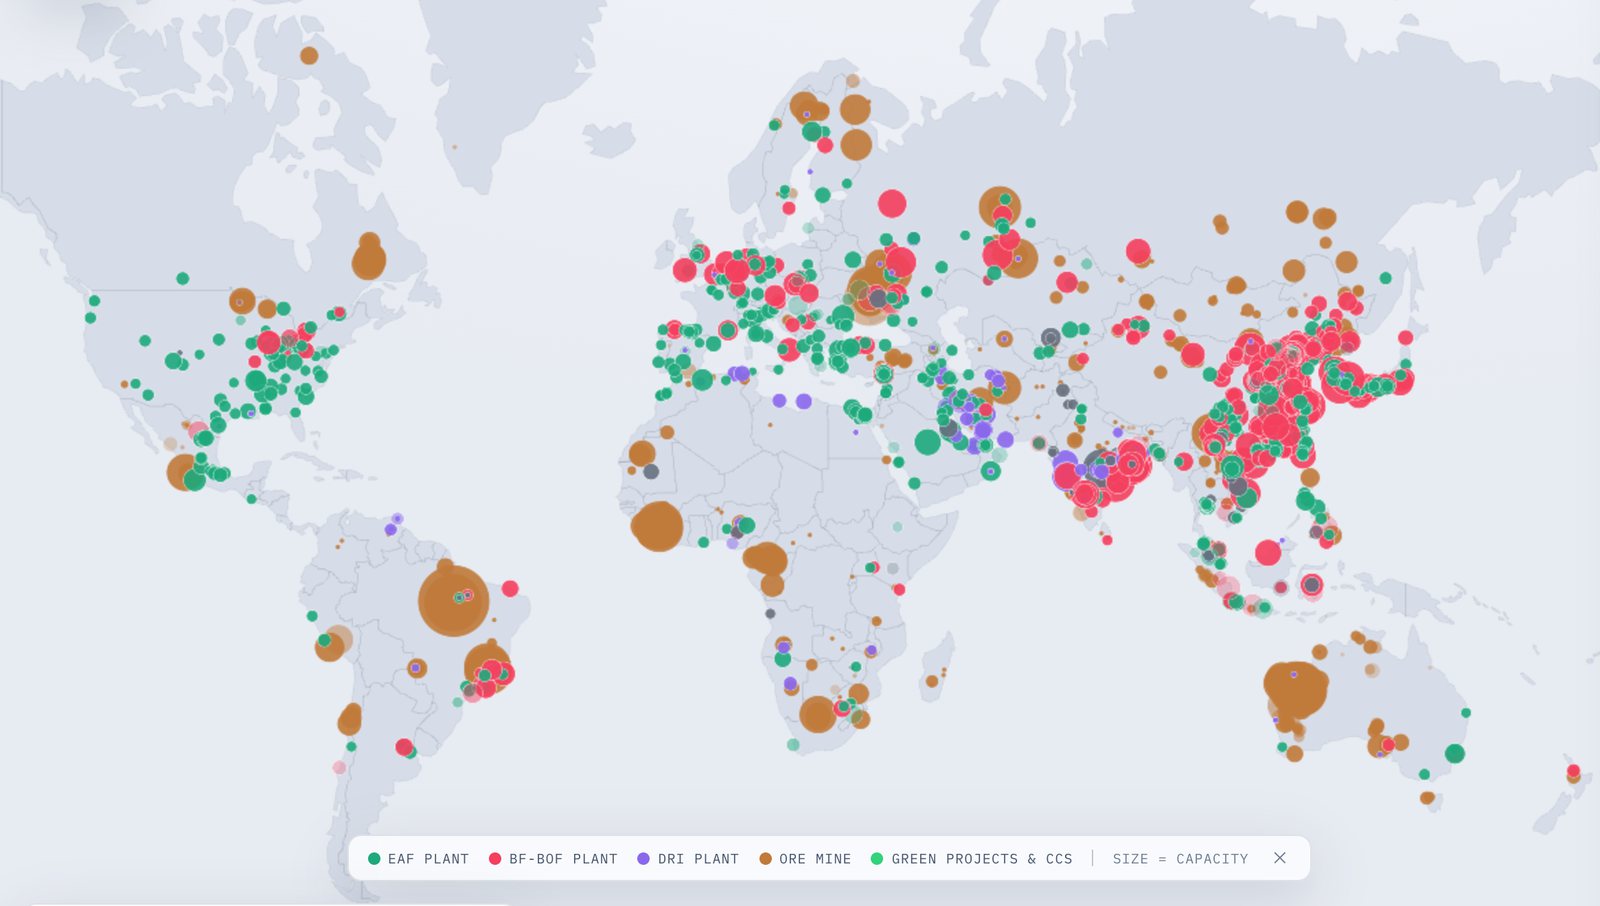
Where steel is made and where the ore is
- 1,293 steel plants tracked; 2.2 Bt a year of operating crude steel capacity
- 980 iron ore mines, 701 operating; 4.06 Gt a year of operating design capacity
- Australia leads operating ore capacity (1,208 Mt a year), then Brazil (605) and India (506)
Steel plants by route (EAF, BF-BOF, DRI) and iron ore mines, sized by capacity. Data: Global Energy Monitor, Global Iron & Steel Tracker and Global Iron Ore Mines Tracker, September 2026 (CC BY 4.0).
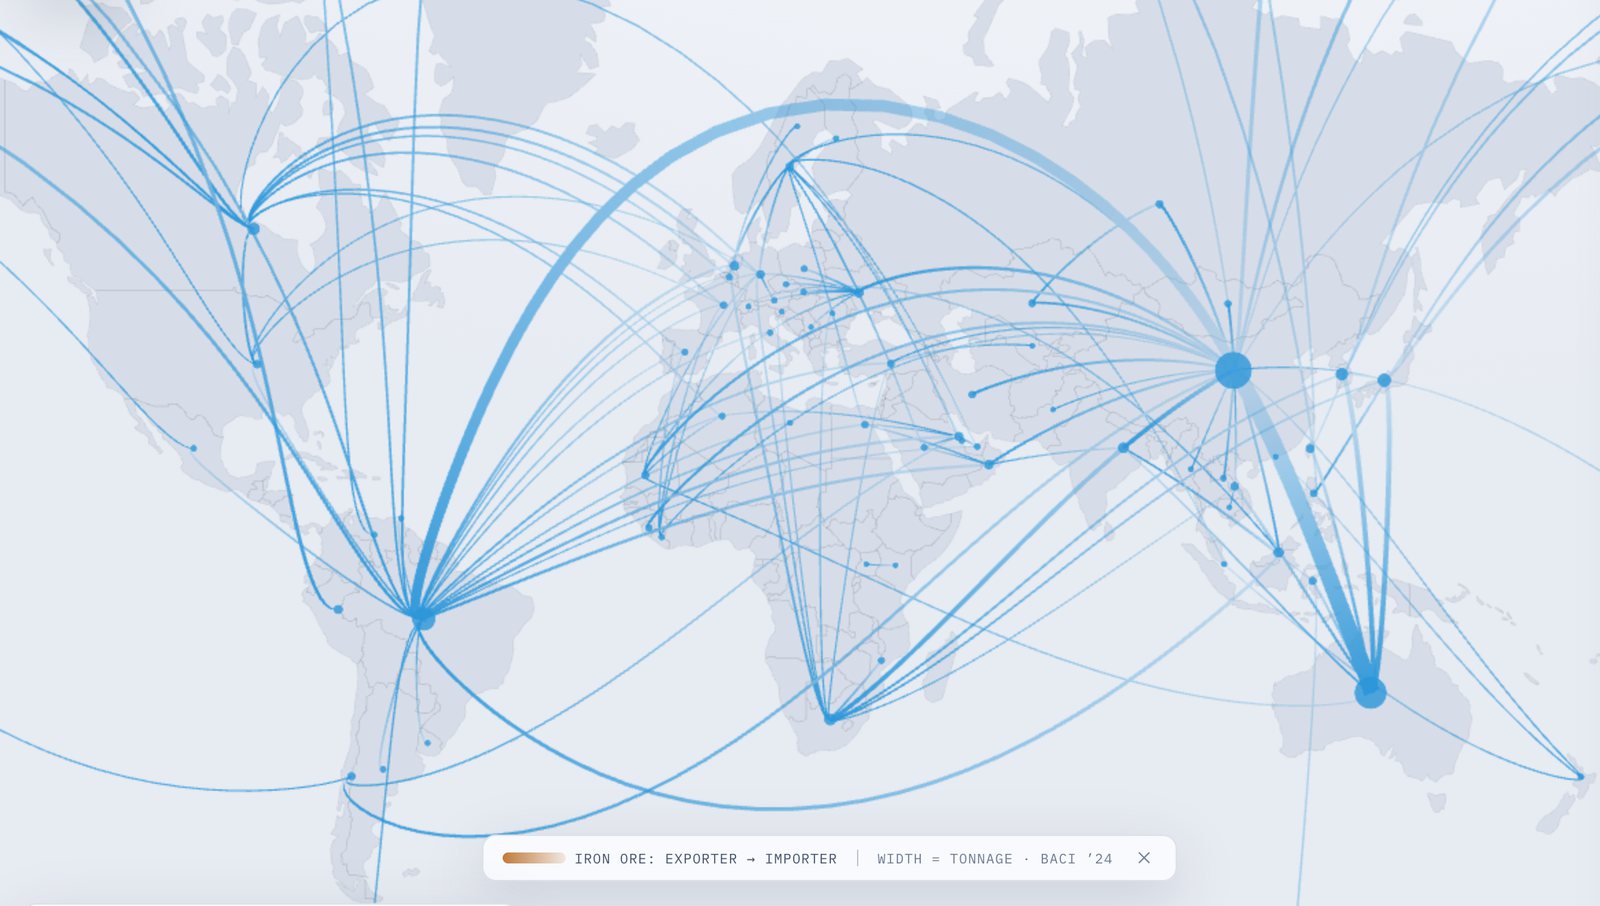
How iron ore moves today: Australia and Brazil to China
- 1,698 Mt of iron ore traded in 2024 across 1,040 bilateral links
- Australia is the top exporter (893 Mt), then Brazil (401 Mt)
- China is the top importer (1,246 Mt); the Atlas also shows DRI/HBI, pig iron, scrap and steel flows
Iron ore exporter-to-importer flows, width by tonnage. Data: CEPII BACI international trade database, HS22, 2024 (release 202601).
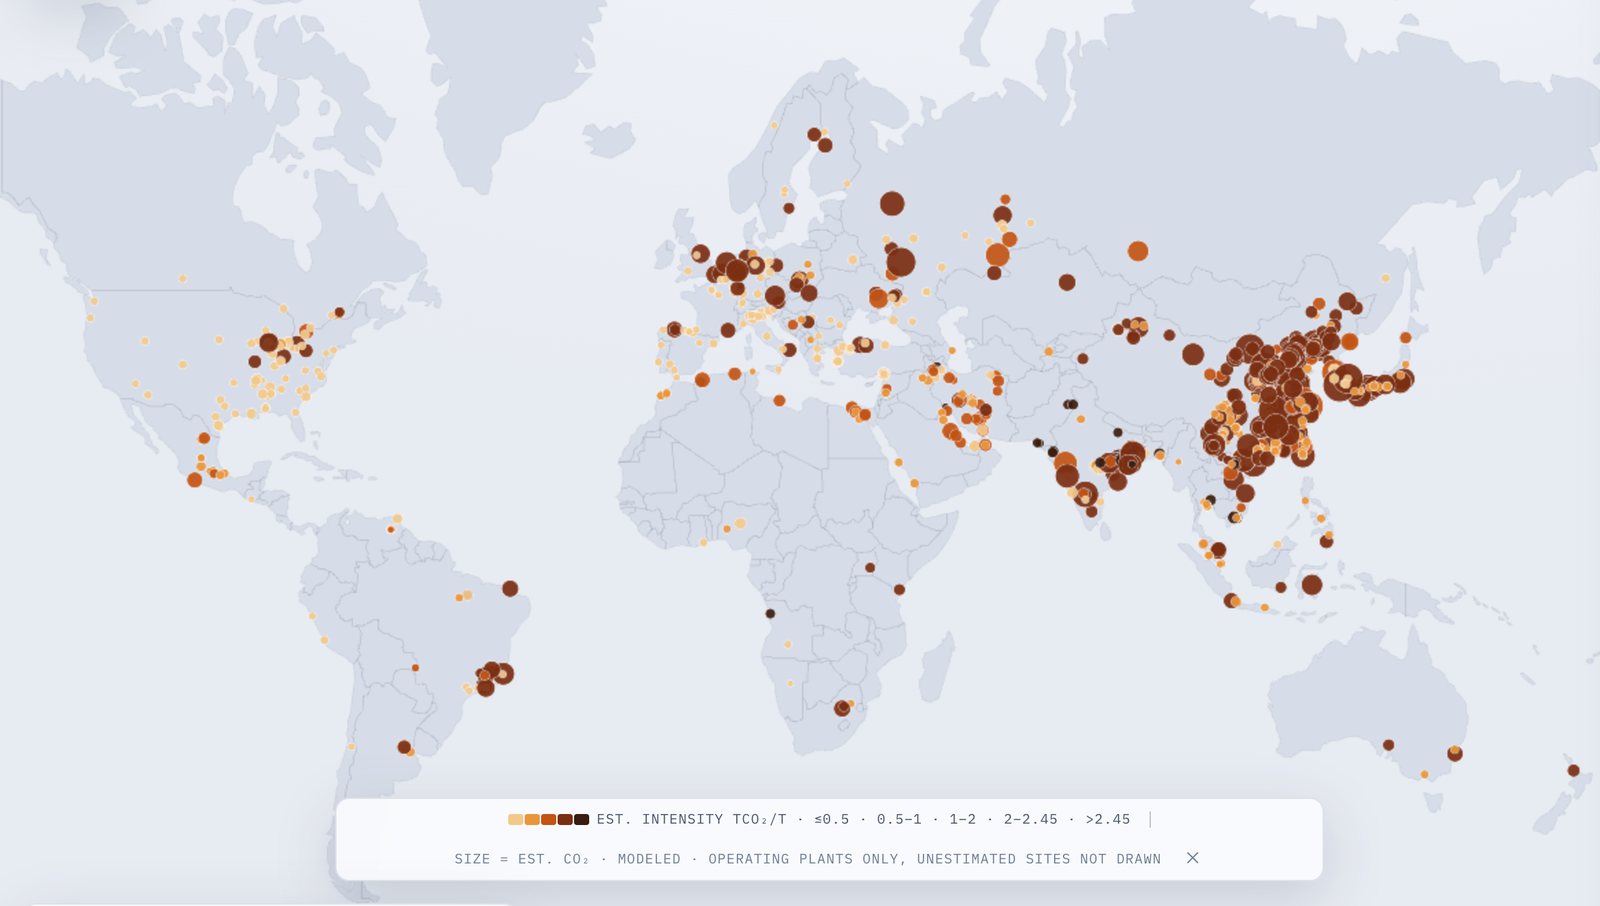
Emissions: 3.4 Gt a year, mostly from coal blast furnaces
- 3.36 Gt CO2 a year modelled for the 970 operating plants covered (range 3.1 to 3.9)
- 83% comes from the BF-BOF coal route; implied intensity 1.87 t CO2 per tonne of crude steel
- 134 Mt a year is avoidable if the announced green pipeline displaces BF-BOF output
Estimated CO2 by plant, colour by intensity, size by emissions; operating plants only. Modelled with route emission factors applied to reported production or capacity; grid intensity from Our World in Data / Ember, 2024. A model, not measurements.
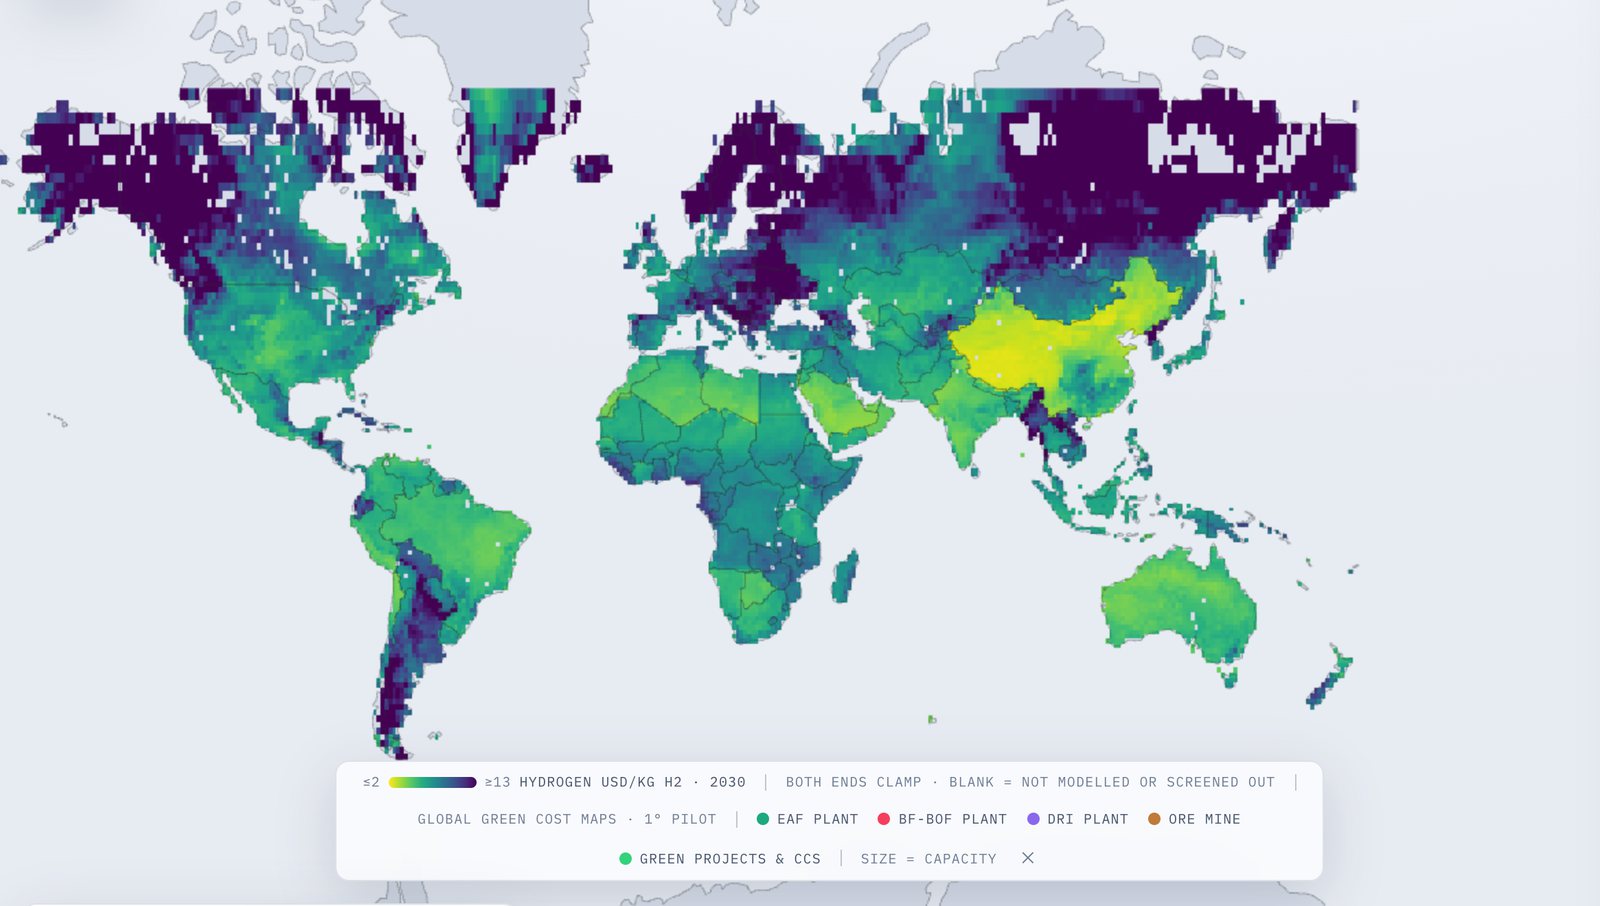
Where green hydrogen will be cheapest in 2030
- Levelised cost of green hydrogen in 2030 on a 1-degree grid; the colour ramp runs from 2 to 13 USD per kg
- Hourly least-cost optimisation of wind, solar, batteries, electrolysers and storage for every onshore cell, weather year 2023
- Modelled estimates, not market prices; 2040 and 2050 surfaces, electricity and ammonia are also in the Atlas
Green hydrogen cost surface, 2030, pilot 1-degree grid; blank cells were not modelled or were screened out. Data: Global Green Cost Maps, Monash University (Changlong Wang and colleagues), 2026.
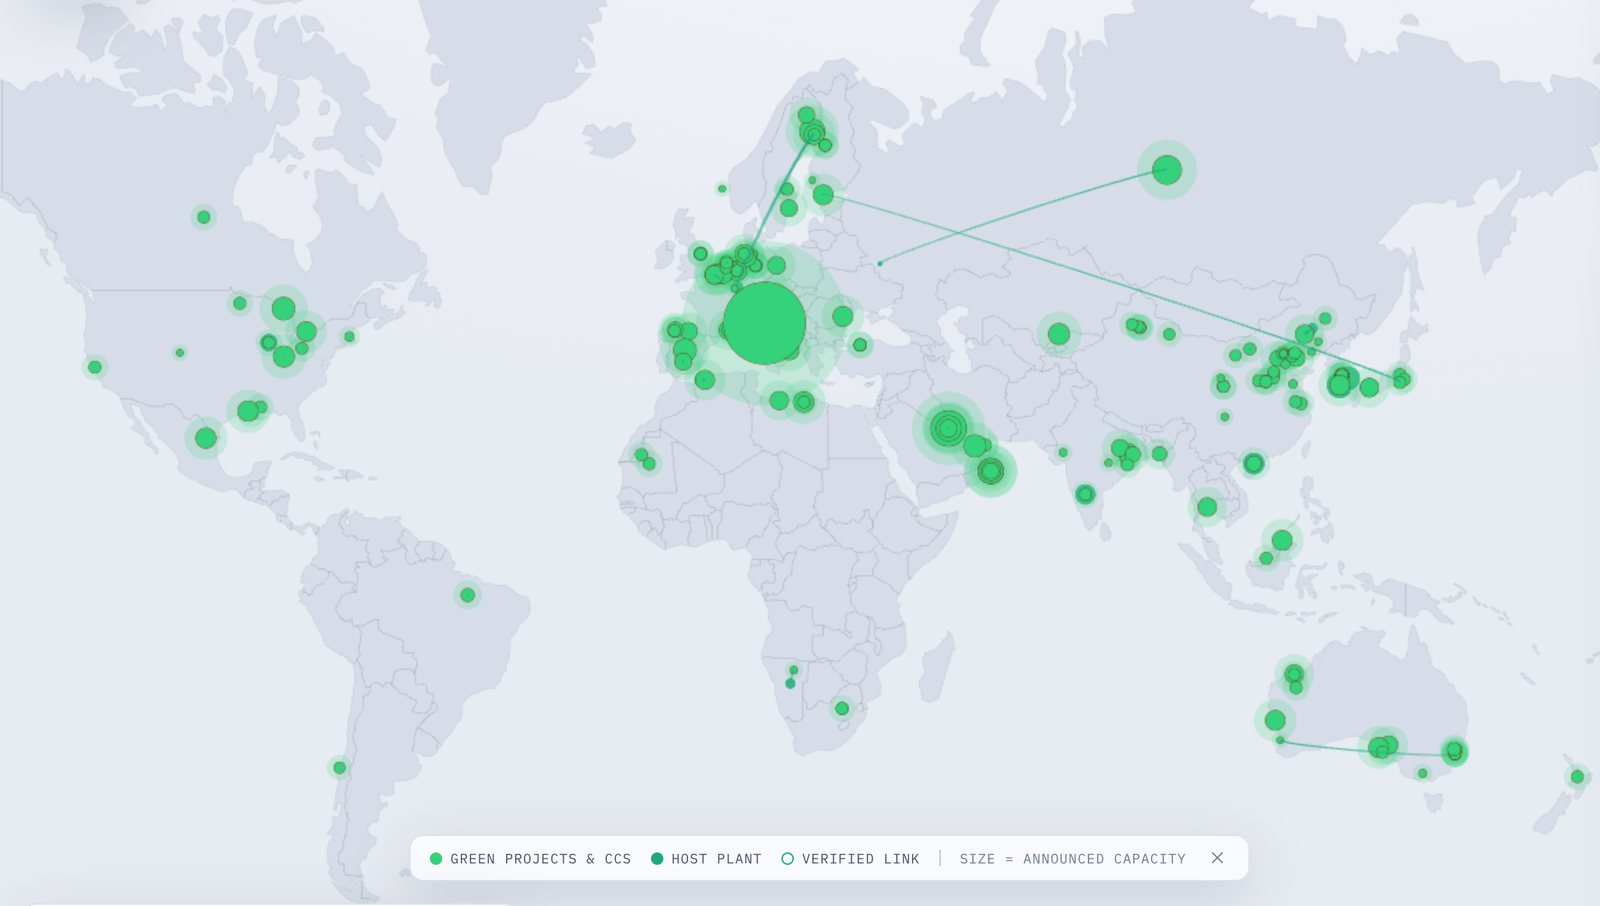
Green projects: 180 announced, 104 hydrogen-based
- 180 green-steel projects with 86 Mt a year of announced capacity and USD 98.7 billion of disclosed investment
- 104 are hydrogen-based; the rest are gas DRI, CCUS, scrap EAF, biomass or novel routes
- 129 hydrogen-ready DRI furnaces built or announced, 52 operating, 7 running on hydrogen today
Green projects and CCS, sized by announced capacity, linked to host plants. Data: LeadIT Green Steel Tracker, 2026 Q1 (158 projects) and CISRI / MCC China hydrogen-metallurgy projects, 2026 (22), matched to Global Energy Monitor plants.
All results
Every question, with its chart and its numbers
Central values are medians and spread is the interquartile range; n is the number of experts who answered. Open a module to see its questions.
About you 104 experts · 7 questions
Which part of Task 52 are you most closely associated with?
| Option | Experts | Share |
|---|---|---|
| Subtask A — Technology assessment and readiness | 27 | 26% |
| Subtask B — Resources, supply chains and infrastructure | 16 | 16% |
| Subtask C — Global pathways, competitiveness and power systems | 19 | 18% |
| Task linkage and exchange — contributing across more than one Subtask, policy advice and international exchange | 12 | 12% |
| Industry or policy reference expert | 21 | 20% |
| Other / not yet assigned | 8 | 8% |
By Task 52 affiliation (groups of at least 5)
- Subtask An=27Subtask A — Technology assessment and readiness 100%
- Subtask Bn=16Subtask B — Resources, supply chains and infrastructure 100%
- Subtask Cn=19Subtask C — Global pathways, competitiveness and power systems 100%
- Linkage and exchangen=12Task linkage and exchange — contributing across more than one Subtask, policy advice and international exchange 100%
- Industry and policy referencen=21Industry or policy reference expert 100%
- Not yet assignedn=8Other / not yet assigned 100%
What is your professional background? Select up to two.
Share of respondents selecting each option.
| Option | Experts | Share selecting |
|---|---|---|
| Economist or techno-economic modeller | 33 | 32% |
| Policy or regulatory analyst | 27 | 26% |
| Metallurgist or materials scientist | 25 | 24% |
| Chemical or process engineer | 20 | 19% |
| Business, strategy or finance professional | 18 | 17% |
| Mechanical, plant or project engineer | 11 | 11% |
| Electrical, energy-systems or power engineer | 9 | 9% |
| Other | 9 | 9% |
| Physical or environmental scientist | 7 | 7% |
| Mining engineer or geologist | 2 | 2% |
By Task 52 affiliation (groups of at least 5)
- Subtask An=27Metallurgist or materials scientist 59%
- Subtask Bn=16Economist or techno-economic modeller 31%
- Subtask Cn=19Economist or techno-economic modeller 68%
- Linkage and exchangen=12Economist or techno-economic modeller 58%
- Industry and policy referencen=21Policy or regulatory analyst 52%
- Not yet assignedn=8Other 38%
Which sector best describes your current organisation?
| Option | Experts | Share |
|---|---|---|
| Industry — iron or steel producer | 8 | 8% |
| Industry — mining or ore supplier | 4 | 4% |
| Industry — technology provider, EPC or equipment | 10 | 10% |
| Industry — energy, hydrogen or utility | 4 | 4% |
| Finance or investment | 0 | 0% |
| Government or public agency | 4 | 4% |
| Intergovernmental or international organisation | 10 | 10% |
| University or research institute | 41 | 40% |
| NGO, think tank or industry association | 15 | 15% |
| Consultancy | 7 | 7% |
By Task 52 affiliation (groups of at least 5)
- Subtask An=27University or research institute 41%
- Subtask Bn=16University or research institute 56%
- Subtask Cn=19University or research institute 63%
- Linkage and exchangen=12University or research institute 42%
- Industry and policy referencen=21NGO, think tank or industry association 24%
- Not yet assignedn=8Intergovernmental or international organisation 25%
Which regions does your expertise mainly relate to? Select up to three.
Share of respondents selecting each option.
| Option | Experts | Share selecting |
|---|---|---|
| Europe | 50 | 49% |
| Global / no specific region | 32 | 31% |
| Australia and New Zealand | 24 | 23% |
| China | 22 | 21% |
| India and South-East Asia | 14 | 14% |
| Japan and South Korea | 11 | 11% |
| Middle East and North Africa | 10 | 10% |
| Brazil and Latin America | 9 | 9% |
| North America | 7 | 7% |
| Sub-Saharan Africa | 0 | 0% |
By Task 52 affiliation (groups of at least 5)
- Subtask An=27Europe 63%
- Subtask Bn=16China 44%
- Subtask Cn=19Europe 74%
- Linkage and exchangen=12Europe 50%
- Industry and policy referencen=21Australia and New Zealand 29%
- Not yet assignedn=8Global / no specific region 50%
How many years have you worked professionally on iron and steel or closely related fields?
Mean score 9.3, median 4.5
| Option | Experts | Share |
|---|---|---|
| Less than 3 years | 20 | 20% |
| 3 to 6 years | 37 | 36% |
| 7 to 15 years | 16 | 16% |
| More than 15 years | 29 | 28% |
By Task 52 affiliation (groups of at least 5)
- Subtask An=26More than 15 years 58%
- Subtask Bn=163 to 6 years 38%
- Subtask Cn=193 to 6 years 58%
- Linkage and exchangen=123 to 6 years 67%
- Industry and policy referencen=21More than 15 years 29%
- Not yet assignedn=8Less than 3 years 38%
Rate your own expertise in each area.
1 = general awareness, 3 = working knowledge, 5 = leading expert. Used to weight answers within modules, never to exclude them.
| Row | n | Mean | Median | IQR |
|---|---|---|---|---|
| Ironmaking and steelmaking process technology | 96 | 3.50 | 4.0 | 3.0 to 4.0 |
| Techno-economics, markets and trade | 97 | 3.37 | 3.0 | 3.0 to 4.0 |
| Renewable electricity, hydrogen production and power systems | 98 | 3.35 | 3.0 | 3.0 to 4.0 |
| Policy, standards, certification and finance | 95 | 3.07 | 3.0 | 2.0 to 4.0 |
| Supply chains, logistics and infrastructure | 92 | 2.76 | 3.0 | 2.0 to 3.0 |
| Iron ore quality, beneficiation and pelletising | 91 | 2.73 | 3.0 | 2.0 to 3.0 |
By Task 52 affiliation (groups of at least 5)
- Subtask An=26Ironmaking and steelmaking process technology 4.2
- Subtask Bn=16Techno-economics, markets and trade 3.8
- Subtask Cn=19Techno-economics, markets and trade 3.6
- Linkage and exchangen=12Policy, standards, certification and finance 3.7
- Industry and policy referencen=21Ironmaking and steelmaking process technology 3.6
- Not yet assignedn=8Renewable electricity, hydrogen production and power systems 3.4
Which Task 52 outputs would be most useful to you and your organisation? Select up to three.
Everyone answers this one: it shapes what Task 52 publishes first.
Share of respondents selecting each option.
| Option | Experts | Share selecting |
|---|---|---|
| Open techno-economic database of routes | 59 | 57% |
| Supply-chain route and cost comparison tool | 40 | 38% |
| Comparison of global scenario studies | 40 | 38% |
| Technology readiness atlas | 38 | 37% |
| Global project tracker | 37 | 36% |
| Workshop and expert dialogue series | 26 | 25% |
| Policy brief series | 21 | 20% |
| Joint peer-reviewed papers | 18 | 17% |
| Input to standards harmonisation | 12 | 12% |
| Researcher and staff exchange | 10 | 10% |
By Task 52 affiliation (groups of at least 5)
- Subtask An=27Technology readiness atlas 56%
- Subtask Bn=16Supply-chain route and cost comparison tool 75%
- Subtask Cn=19Open techno-economic database of routes 58%
- Linkage and exchangen=12Open techno-economic database of routes 58%
- Industry and policy referencen=21Open techno-economic database of routes 43%
- Not yet assignedn=8Open techno-economic database of routes 75%
Cross-cutting outlook 104 experts · 9 questions
Allocate global crude steel production in 2040 across production routes (percent, summing to 100).
For reference, 2024 shares were roughly: BF-BOF 70%, scrap-based EAF 22%, natural-gas DRI-EAF 7%, other 1% (worldsteel). Enter your expected 2040 shares.
Box: interquartile range · thick line: median · whiskers: min–max · number: median · purple line: reference value
| Option | n | Median | IQR | Range | Reference |
|---|---|---|---|---|---|
| BF-BOF, unabated | 88 | 42.0 | 30.0 to 50.0 | 5 to 71 | 70 |
| BF-BOF with CCUS and/or hydrogen injection | 88 | 5.0 | 2.8 to 10.0 | 0 to 32 | 0 |
| Natural-gas DRI-EAF, with or without CCS | 87 | 12.0 | 10.0 to 15.0 | 4 to 30 | 7 |
| Hydrogen-based DRI-EAF, including imported green iron | 88 | 5.6 | 3.0 to 10.0 | 0 to 30 | 0 |
| Scrap-based EAF | 88 | 30.0 | 25.0 to 35.0 | 10 to 60 | 22 |
| Other novel routes (electrolysis, smelting reduction, plasma) | 79 | 2.0 | 1.0 to 3.0 | 0 to 10 | 1 |
By Task 52 affiliation (groups of at least 5)
- Subtask An=26BF-BOF, unabated 48
- Subtask Bn=15BF-BOF, unabated 39
- Subtask Cn=16BF-BOF, unabated 40
- Linkage and exchangen=11BF-BOF, unabated 40
- Industry and policy referencen=14BF-BOF, unabated 45
- Not yet assignedn=6BF-BOF, unabated 41
In which year will at least 10 million tonnes per year of hydrogen-based DRI capacity be in commercial operation globally?
Give the year by which you assign a 10% chance, a 50% chance and a 90% chance. Fill the 10% and 90% years first. Hydrogen-based means at least 90% hydrogen; today roughly 1 to 2 Mt/yr is under commissioning.
10% chance by
2032
IQR 2030–2035 · never: 1
50% chance by
2037
IQR 2035–2040 · never: 1
90% chance by
2042
IQR 2040–2050 · never: 2
Pooled cumulative probability: average of each expert's piecewise-linear curve through their 10%, 50% and 90% years.
| Percentile | n | Median year | IQR | Range | “Never” |
|---|---|---|---|---|---|
| 10% chance by | 88 | 2032 | 2030 to 2035 | 2027 to 2050 | 1 |
| 50% chance by | 88 | 2037 | 2035 to 2040 | 2028 to 2055 | 1 |
| 90% chance by | 87 | 2042 | 2040 to 2050 | 2030 to 2055 | 2 |
By Task 52 affiliation (groups of at least 5)
- Subtask An=2550% chance by 2035
- Subtask Bn=1650% chance by 2039
- Subtask Cn=1550% chance by 2035
- Linkage and exchangen=1150% chance by 2036
- Industry and policy referencen=1650% chance by 2040
- Not yet assignedn=650% chance by 2039
What production-cost premium will hydrogen-based DRI-EAF crude steel carry over BF-BOF in the best-in-class location, excluding carbon pricing and subsidies?
| Row | n | Below BF-BOF cost | 0 to 10% | 10 to 25% | 25 to 50% | Above 50% |
|---|---|---|---|---|---|---|
| 2030 | 84 | 1% | 6% | 19% | 46% | 27% |
| 2035 | 83 | 1% | 13% | 42% | 35% | 8% |
| 2040 | 82 | 5% | 37% | 40% | 13% | 5% |
By Task 52 affiliation (groups of at least 5)
- Subtask An=222030: 25 to 50% 41%
- Subtask Bn=152030: 25 to 50% 60%
- Subtask Cn=162030: 25 to 50% 63%
- Linkage and exchangen=112030: 10 to 25% 36%
- Industry and policy referencen=152030: 25 to 50% 40%
- Not yet assignedn=52030: Above 50% 80%
Rank the three biggest barriers to reaching final investment decision on commercial-scale hydrogen-based ironmaking projects today.
Borda score as a share of the maximum (rank 1 = 3 points, rank 3 = 1 point) · share ranking it first.
| Option | Borda share | Ranked first | Mentioned |
|---|---|---|---|
| Offtake and green-premium uncertainty | 63% | 44% | 80% |
| Hydrogen or electricity price risk | 53% | 32% | 70% |
| Durability and predictability of policy support | 20% | 4% | 38% |
| Carbon price and CBAM implementation uncertainty | 18% | 7% | 31% |
| Cost of capital and balance-sheet constraints | 13% | 4% | 23% |
| First-of-a-kind technology risk | 9% | 3% | 13% |
| Capex escalation and EPC capacity | 8% | 3% | 13% |
| Permitting and grid-connection delays | 7% | 1% | 13% |
| Security of DR-grade ore supply | 7% | 1% | 15% |
| Skilled workforce availability | 2% | 1% | 3% |
By Task 52 affiliation (groups of at least 5)
- Subtask An=26Hydrogen or electricity price risk (Borda 71%)
- Subtask Bn=16Offtake and green-premium uncertainty (Borda 60%)
- Subtask Cn=18Offtake and green-premium uncertainty (Borda 70%)
- Linkage and exchangen=11Offtake and green-premium uncertainty (Borda 58%)
- Industry and policy referencen=20Offtake and green-premium uncertainty (Borda 67%)
- Not yet assignedn=7Offtake and green-premium uncertainty (Borda 86%)
Rank the three policy instruments that would most accelerate hydrogen-based ironmaking deployment over the next five years.
Borda score as a share of the maximum (rank 1 = 3 points, rank 3 = 1 point) · share ranking it first.
| Option | Borda share | Ranked first | Mentioned |
|---|---|---|---|
| Lead markets or quotas for near-zero steel | 33% | 16% | 47% |
| Capital grants for first plants | 28% | 17% | 37% |
| Carbon contracts for difference or production subsidies | 25% | 14% | 37% |
| Domestic carbon pricing | 23% | 17% | 29% |
| Hydrogen production tax credits or subsidies | 21% | 9% | 36% |
| Green public procurement | 17% | 4% | 27% |
| Border carbon adjustment (CBAM) | 16% | 8% | 24% |
| Bilateral green iron and steel trade agreements | 16% | 7% | 27% |
| Product standards and embodied-carbon limits | 8% | 3% | 14% |
| Concessional finance, export credit or blended finance | 8% | 3% | 12% |
| Harmonised definitions and certification | 4% | 1% | 10% |
By Task 52 affiliation (groups of at least 5)
- Subtask An=22Capital grants for first plants (Borda 38%)
- Subtask Bn=15Border carbon adjustment (CBAM) (Borda 38%)
- Subtask Cn=16Lead markets or quotas for near-zero steel (Borda 42%)
- Linkage and exchangen=12Lead markets or quotas for near-zero steel (Borda 42%)
- Industry and policy referencen=20Lead markets or quotas for near-zero steel (Borda 38%)
- Not yet assignedn=7Hydrogen production tax credits or subsidies (Borda 38%)
What share of global hydrogen-based DRI/HBI output will be traded internationally as merchant iron in 2040, rather than consumed at the site of production?
Give the lowest plausible and highest plausible values first, then your best estimate.
Median low
12.0
Median best
30.0
IQR 20.0–50.0
Median high
50.0
One line per expert (lowest to highest plausible), dot: best estimate, sorted by best estimate · shaded band: interquartile range of best estimates · dashed: median
Unit: % of hydrogen-based DRI/HBI output
| Estimate | n | Median | IQR | Range | Mean |
|---|---|---|---|---|---|
| Lowest plausible | 71 | 12 | 6 to 28 | 0 to 80 | 18.7 |
| Best estimate | 71 | 30 | 20 to 50 | 2 to 92 | 35.5 |
| Highest plausible | 71 | 50 | 30 to 70 | 5 to 100 | 50.9 |
By Task 52 affiliation (groups of at least 5)
- Subtask An=20best 30% of hydrogen-based DRI/HBI output
- Subtask Bn=13best 25% of hydrogen-based DRI/HBI output
- Subtask Cn=12best 34% of hydrogen-based DRI/HBI output
- Linkage and exchangen=8best 25% of hydrogen-based DRI/HBI output
- Industry and policy referencen=13best 40% of hydrogen-based DRI/HBI output
- Not yet assignedn=5best 25% of hydrogen-based DRI/HBI output
On what basis should Task 52 define near-zero emission iron and steel?
| Option | Experts | Share |
|---|---|---|
| An emissions-intensity threshold, technology-neutral | 50 | 52% |
| Eligible production routes | 4 | 4% |
| A threshold combined with route eligibility rules | 30 | 31% |
| No single definition; report multiple metrics | 12 | 13% |
By Task 52 affiliation (groups of at least 5)
- Subtask An=24An emissions-intensity threshold, technology-neutral 54%
- Subtask Bn=16An emissions-intensity threshold, technology-neutral 56%
- Subtask Cn=17An emissions-intensity threshold, technology-neutral 53%
- Linkage and exchangen=12A threshold combined with route eligibility rules 58%
- Industry and policy referencen=20An emissions-intensity threshold, technology-neutral 60%
- Not yet assignedn=7An emissions-intensity threshold, technology-neutral 57%
Which emissions scope boundary should that definition use?
| Option | Experts | Share |
|---|---|---|
| Scope 1 and 2 only | 24 | 26% |
| Scope 1 and 2 plus upstream Scope 3 (mining, ore processing, transport) | 58 | 62% |
| Full life cycle including downstream use | 10 | 11% |
| Don't know | 2 | 2% |
By Task 52 affiliation (groups of at least 5)
- Subtask An=23Scope 1 and 2 plus upstream Scope 3 (mining, ore processing, transport) 74%
- Subtask Bn=16Scope 1 and 2 plus upstream Scope 3 (mining, ore processing, transport) 50%
- Subtask Cn=17Scope 1 and 2 plus upstream Scope 3 (mining, ore processing, transport) 71%
- Linkage and exchangen=12Scope 1 and 2 plus upstream Scope 3 (mining, ore processing, transport) 67%
- Industry and policy referencen=19Scope 1 and 2 plus upstream Scope 3 (mining, ore processing, transport) 42%
- Not yet assignedn=7Scope 1 and 2 plus upstream Scope 3 (mining, ore processing, transport) 71%
For commercial-scale DRI projects reaching final investment decision in 2026 to 2028, which initial reductant configuration do you expect to be most common?
| Option | Experts | Share |
|---|---|---|
| Hydrogen from commissioning | 2 | 2% |
| Natural gas at start with a planned transition to hydrogen | 59 | 64% |
| Mixed, differing by region | 30 | 33% |
| Too early to say | 1 | 1% |
By Task 52 affiliation (groups of at least 5)
- Subtask An=24Natural gas at start with a planned transition to hydrogen 67%
- Subtask Bn=15Natural gas at start with a planned transition to hydrogen 47%
- Subtask Cn=17Natural gas at start with a planned transition to hydrogen 71%
- Linkage and exchangen=12Mixed, differing by region 50%
- Industry and policy referencen=18Natural gas at start with a planned transition to hydrogen 78%
- Not yet assignedn=6Natural gas at start with a planned transition to hydrogen 83%
Technology readiness and process integration 47 experts · 13 questions
What is the current technology readiness of each route?
Use the IEA scale: TRL 1 to 4 concept and lab, 5 to 6 pilot, 7 to 8 demonstration and first-of-a-kind, 9 and above commercial with multiple plants.
| Row | n | TRL 1 to 4 | TRL 5 to 6 | TRL 7 to 8 | TRL 9 or above |
|---|---|---|---|---|---|
| Shaft-furnace DRI on 100% hydrogen, DR-grade pellets | 41 | 0% | 20% | 71% | 10% |
| Shaft-furnace DRI on natural gas with 30% or more hydrogen blending | 41 | 0% | 2% | 39% | 59% |
| Fluidised-bed hydrogen reduction of fines | 39 | 13% | 51% | 36% | 0% |
| Hydrogen DRI plus electric smelting furnace for lower-grade ores | 40 | 10% | 48% | 38% | 5% |
| Hydrogen plasma or smelting reduction | 38 | 45% | 55% | 0% | 0% |
| Molten oxide electrolysis | 38 | 47% | 42% | 11% | 0% |
| Low-temperature aqueous iron electrowinning | 38 | 47% | 45% | 8% | 0% |
| Blast furnace with hydrogen injection | 41 | 5% | 20% | 44% | 32% |
| BF-BOF with CCUS | 41 | 7% | 29% | 54% | 10% |
| Biomass or biochar-based ironmaking | 41 | 7% | 15% | 39% | 39% |
By Task 52 affiliation (groups of at least 5)
- Subtask An=22Shaft-furnace DRI on 100% hydrogen, DR-grade pellets: TRL 7 to 8 73%
- Industry and policy referencen=11Shaft-furnace DRI on 100% hydrogen, DR-grade pellets: TRL 7 to 8 55%
When will the first commercial-scale plant (at least 1 Mt/yr) be operating for each route?
| Row | n | Already operating | By 2028 | 2029 to 2032 | 2033 to 2036 | 2037 to 2040 | After 2040 | Never |
|---|---|---|---|---|---|---|---|---|
| Shaft-furnace DRI on 100% hydrogen | 39 | 8% | 41% | 41% | 3% | 5% | 3% | 0% |
| Fluidised-bed hydrogen reduction of fines | 36 | 6% | 0% | 22% | 56% | 8% | 8% | 0% |
| Hydrogen DRI plus electric smelting furnace | 37 | 3% | 8% | 43% | 27% | 16% | 3% | 0% |
| Hydrogen plasma or smelting reduction | 35 | 0% | 0% | 3% | 20% | 34% | 40% | 3% |
| Molten oxide electrolysis | 35 | 3% | 3% | 0% | 14% | 20% | 46% | 14% |
| Low-temperature iron electrowinning | 35 | 0% | 0% | 3% | 26% | 17% | 49% | 6% |
By Task 52 affiliation (groups of at least 5)
- Subtask An=20Shaft-furnace DRI on 100% hydrogen: 2029 to 2032 55%
- Industry and policy referencen=10Shaft-furnace DRI on 100% hydrogen: By 2028 50%
Which route will process most low-grade hematite ore into hydrogen-based iron by 2035?
Self-rated confidence: mean 3.5 of 5
| Option | Experts | Share |
|---|---|---|
| Beneficiation to DR-grade pellets, then shaft-furnace DRI-EAF | 6 | 15% |
| Shaft-furnace DRI on lower-grade pellets, then electric smelting furnace and BOF | 16 | 41% |
| Fluidised-bed reduction of fines, then electric smelting furnace | 4 | 10% |
| Direct smelting reduction or hydrogen plasma on fines | 3 | 8% |
| Low-grade ore stays in BF-BOF, abated with CCUS | 1 | 3% |
| Low-grade ore will largely not be used for hydrogen-based iron by 2035 | 9 | 23% |
By Task 52 affiliation (groups of at least 5)
- Subtask An=21Shaft-furnace DRI on lower-grade pellets, then electric smelting furnace and BOF 48%
- Subtask Bn=5Shaft-furnace DRI on lower-grade pellets, then electric smelting furnace and BOF 40%
- Industry and policy referencen=8Shaft-furnace DRI on lower-grade pellets, then electric smelting furnace and BOF 38%
What total electricity input per tonne of crude steel will a best-in-class hydrogen-based DRI-EAF plant need in 2035, including electrolysis but excluding mining and pelletising?
Published estimates today span roughly 3.5 to 5 MWh/t. Give lowest plausible, highest plausible and best estimate.
Median low
3.3
Median best
4.0
IQR 3.5–4.5
Median high
5.0
One line per expert (lowest to highest plausible), dot: best estimate, sorted by best estimate · shaded band: interquartile range of best estimates · dashed: median
Unit: MWh per tonne of crude steel
| Estimate | n | Median | IQR | Range | Mean |
|---|---|---|---|---|---|
| Lowest plausible | 33 | 3.3 | 3.0 to 3.5 | 1.0 to 4.5 | 3.15 |
| Best estimate | 33 | 4.0 | 3.5 to 4.5 | 2.0 to 6.0 | 4.08 |
| Highest plausible | 33 | 5.0 | 4.5 to 5.5 | 3.0 to 7.8 | 5.13 |
By Task 52 affiliation (groups of at least 5)
- Subtask An=16best 4.3 MWh per tonne of crude steel
- Subtask Bn=5best 3.7 MWh per tonne of crude steel
- Industry and policy referencen=7best 3.5 MWh per tonne of crude steel
Rank the three most important technical barriers to scaling hydrogen-based DRI from demonstration to multiple commercial plants.
Borda score as a share of the maximum (rank 1 = 3 points, rank 3 = 1 point) · share ranking it first.
| Option | Borda share | Ranked first | Mentioned |
|---|---|---|---|
| Hydrogen supply variability and buffering | 73% | 63% | 83% |
| Availability and consistency of DR-grade pellets | 29% | 10% | 44% |
| Heat balance and gas preheating with hydrogen | 26% | 15% | 37% |
| Pellet sticking, fines generation and shaft-furnace behaviour with hydrogen | 15% | 0% | 29% |
| DRI carbon content and metallisation for EAF steelmaking | 15% | 2% | 32% |
| Hydrogen safety and materials compatibility | 15% | 2% | 27% |
| Process control and operating experience | 12% | 5% | 20% |
| Scale-up of fluidised-bed reactors | 11% | 2% | 20% |
| Equipment supply chain and EPC capacity | 3% | 0% | 10% |
By Task 52 affiliation (groups of at least 5)
- Subtask An=21Hydrogen supply variability and buffering (Borda 79%)
- Subtask Bn=5Hydrogen supply variability and buffering (Borda 100%)
- Industry and policy referencen=9Hydrogen supply variability and buffering (Borda 67%)
How serious is each challenge for EAF-based steelmaking on hydrogen DRI?
| Row | n | Mean | Median | IQR |
|---|---|---|---|---|
| Gangue and slag volume from lower-grade DRI | 35 | 4.26 | 5.0 | 4.0 to 5.0 |
| Scrap residuals (copper, tin) limiting product mix | 35 | 3.51 | 3.0 | 3.0 to 5.0 |
| EAF productivity, electrode and power demand | 33 | 3.21 | 3.0 | 3.0 to 4.0 |
| Quality for high-grade flat products | 35 | 3.20 | 3.0 | 2.0 to 4.0 |
| Integration of an electric smelting furnace before the BOF | 35 | 2.91 | 3.0 | 2.0 to 4.0 |
| HBI reoxidation, handling and transport safety | 35 | 2.51 | 3.0 | 2.0 to 3.0 |
| Operating skills and workforce transition | 33 | 2.45 | 2.0 | 2.0 to 3.0 |
By Task 52 affiliation (groups of at least 5)
- Subtask An=20Gangue and slag volume from lower-grade DRI 4.5
- Industry and policy referencen=9Gangue and slag volume from lower-grade DRI 3.7
Which data are hardest to obtain for assessing hydrogen-based ironmaking technologies? Select up to three.
Share of respondents selecting each option.
| Option | Experts | Share selecting |
|---|---|---|
| Operating costs and availability of demonstration plants | 30 | 77% |
| Realised capex of demonstration and first commercial plants | 27 | 69% |
| Measured energy and hydrogen consumption | 15 | 38% |
| Reliability, maintenance and failure data | 13 | 33% |
| Ore and pellet performance in hydrogen reduction | 8 | 21% |
| DRI/HBI product quality and downstream performance | 8 | 21% |
| Verified emissions accounting | 6 | 15% |
| Project pipeline status and cancellations | 5 | 13% |
| Other (please specify) | 1 | 3% |
By Task 52 affiliation (groups of at least 5)
- Subtask An=19Operating costs and availability of demonstration plants 79%
- Industry and policy referencen=10Realised capex of demonstration and first commercial plants 80%
Based on publicly available evidence, how important is each technical challenge for scaling hydrogen-based DRI?
| Row | n | Mean | Median | IQR |
|---|---|---|---|---|
| Hydrogen supply reliability, pressure and purity at the plant boundary | 31 | 3.87 | 4.0 | 3.5 to 5.0 |
| Pellet sticking, clustering or fines generation in the shaft | 32 | 3.53 | 4.0 | 3.0 to 4.0 |
| Electric smelting furnace slag chemistry and arc stability at scale | 30 | 3.50 | 4.0 | 3.0 to 4.0 |
| Behaviour of magnetite or lower-grade ore in fluidised or flash reduction | 28 | 3.46 | 4.0 | 3.0 to 4.0 |
| Meeting metallisation and carbon-content targets at the same time | 32 | 3.44 | 4.0 | 3.0 to 4.0 |
| Refractory and burner-material wear under high-hydrogen operation | 28 | 3.18 | 3.0 | 3.0 to 4.0 |
| Availability shortfall against design in the first two years | 24 | 3.13 | 3.0 | 2.8 to 4.0 |
| DRI or HBI reoxidation during handling, storage and transport | 31 | 2.77 | 3.0 | 2.0 to 3.0 |
By Task 52 affiliation (groups of at least 5)
- Subtask An=19Hydrogen supply reliability, pressure and purity at the plant boundary 3.9
- Industry and policy referencen=7Hydrogen supply reliability, pressure and purity at the plant boundary 4.1
For a representative first-of-a-kind commercial-scale hydrogen shaft-furnace DRI plant, what capacity factor is it reasonable to expect over the first 24 months of commercial operation?
Capacity factor means annual output divided by nameplate annual capacity. Judge from public evidence and general experience of first-of-a-kind process plants; do not use non-public information about any specific plant.
Median low
40.0
Median best
65.0
IQR 55.0–70.0
Median high
80.0
One line per expert (lowest to highest plausible), dot: best estimate, sorted by best estimate · shaded band: interquartile range of best estimates · dashed: median
Unit: % of nameplate capacity
| Estimate | n | Median | IQR | Range | Mean |
|---|---|---|---|---|---|
| Lowest plausible | 33 | 40 | 30 to 55 | 5 to 70 | 42.5 |
| Best estimate | 33 | 65 | 55 to 70 | 10 to 90 | 62.9 |
| Highest plausible | 33 | 80 | 80 to 90 | 15 to 100 | 81.4 |
By Task 52 affiliation (groups of at least 5)
- Subtask An=16best 63% of nameplate capacity
- Industry and policy referencen=9best 65% of nameplate capacity
By 2035, what will be the dominant source of the carbon added to hydrogen-based DRI to reach the carburisation needed for EAF steelmaking?
| Option | Experts | Share |
|---|---|---|
| Natural gas or methane injection, used pragmatically despite the emissions | 28 | 65% |
| Biochar or other solid biogenic carbon | 7 | 16% |
| Biogenic CO2 or biomethane | 2 | 5% |
| A mix with no single dominant source | 6 | 14% |
| Process design minimises the need for added carbon | 0 | 0% |
By Task 52 affiliation (groups of at least 5)
- Subtask An=21Natural gas or methane injection, used pragmatically despite the emissions 62%
- Subtask Bn=5Natural gas or methane injection, used pragmatically despite the emissions 60%
- Industry and policy referencen=12Natural gas or methane injection, used pragmatically despite the emissions 58%
For flat, high-quality steel made from hydrogen DRI via an electric smelting furnace, which melting vessel will take most of the global tonnage by 2035?
| Option | Experts | Share |
|---|---|---|
| BOF dominates; smelter hot metal is treated like blast-furnace hot metal | 16 | 41% |
| EAF dominates; smelter hot metal is blended with scrap | 14 | 36% |
| Roughly even, differing by region and product | 6 | 15% |
| Neither; smelter-route tonnage stays marginal by 2035 | 3 | 8% |
By Task 52 affiliation (groups of at least 5)
- Subtask An=20BOF dominates; smelter hot metal is treated like blast-furnace hot metal 50%
- Industry and policy referencen=10EAF dominates; smelter hot metal is blended with scrap 60%
For hydrogen DRI plants commissioned between 2028 and 2035 that are co-located with their own melt shop, which product-handling approach will be more common?
| Option | Experts | Share |
|---|---|---|
| Hot DRI charged directly to the melter, no HBI step | 24 | 71% |
| Hot-transport-vessel charging with partial cooling | 6 | 18% |
| Cooled to HBI even at co-located sites, for flexibility and storage | 3 | 9% |
| Roughly even split | 1 | 3% |
By Task 52 affiliation (groups of at least 5)
- Subtask An=18Hot DRI charged directly to the melter, no HBI step 72%
- Industry and policy referencen=8Hot DRI charged directly to the melter, no HBI step 63%
What will total water consumption be for a best-in-class hydrogen-based DRI-EAF plant in 2035, including electrolysis feed water and process cooling but excluding mining and beneficiation, per tonne of crude steel?
Electrolysis alone needs roughly 9 litres of water per kilogram of hydrogen.
Median low
5.0
Median best
8.7
IQR 3.9–13.0
Median high
12.8
One line per expert (lowest to highest plausible), dot: best estimate, sorted by best estimate · shaded band: interquartile range of best estimates · dashed: median
Unit: m³ water per tonne of crude steel
| Estimate | n | Median | IQR | Range | Mean |
|---|---|---|---|---|---|
| Lowest plausible | 16 | 5.0 | 1.0 to 11.0 | 0.3 to 12.1 | 5.73 |
| Best estimate | 16 | 8.7 | 3.9 to 13.0 | 1.9 to 15.0 | 8.59 |
| Highest plausible | 16 | 12.8 | 4.8 to 15.3 | 3.0 to 20.0 | 11.19 |
By Task 52 affiliation (groups of at least 5)
- Subtask An=10best 11.5 m³ water per tonne of crude steel
Process flexibility 34 experts · 8 questions
What minimum stable production rate, as a share of nameplate, will a hydrogen shaft-furnace DRI plant sustain in 2030 without damaging refractories or product quality?
Consider sustained operation for days, not brief dips. Today's natural-gas shaft furnaces typically run close to nameplate.
Mean score 68.0, median 70.0 · Self-rated confidence: mean 3.8 of 5
| Option | Experts | Share |
|---|---|---|
| Below 30% of nameplate | 2 | 10% |
| 30 to 50% | 1 | 5% |
| 50 to 70% | 7 | 35% |
| 70 to 90% | 7 | 35% |
| No meaningful turndown; the plant must run near 100% | 3 | 15% |
By Task 52 affiliation (groups of at least 5)
- Subtask An=1370 to 90% 46%
- Industry and policy referencen=550 to 70% 60%
How quickly will a hydrogen-based DRI plant be able to move between 50% and 100% of nameplate production in 2030?
Mean score 16.1, median 15.0
| Option | Experts | Share |
|---|---|---|
| Under 1 hour | 2 | 9% |
| 1 to 6 hours | 7 | 32% |
| 6 to 24 hours | 8 | 36% |
| More than 24 hours | 4 | 18% |
| Only through planned weekly or seasonal scheduling | 1 | 5% |
By Task 52 affiliation (groups of at least 5)
- Subtask An=146 to 24 hours 43%
- Industry and policy referencen=51 to 6 hours 40%
Where should the flexibility in a renewable-powered hydrogen DRI system sit? Allocate 100 points across the options by the share of load-following each should provide in a least-cost 2035 design.
Box: interquartile range · thick line: median · whiskers: min–max · number: median
| Option | n | Median | IQR | Range | Reference |
|---|---|---|---|---|---|
| Electrolyser modulation | 19 | 25.0 | 13.5 to 34.5 | 9 to 40 | – |
| Hydrogen storage (pipes, tanks, caverns) | 18 | 25.0 | 10.0 to 29.1 | 3 to 74 | – |
| DRI plant load modulation | 17 | 10.0 | 5.3 to 20.0 | 4 to 25 | – |
| DRI/HBI inventory buffering before the EAF | 16 | 7.5 | 5.0 to 16.6 | 5 to 25 | – |
| EAF scheduling and melt-shop flexibility | 14 | 10.0 | 5.0 to 10.4 | 0 to 25 | – |
| Grid imports and firm power contracts | 17 | 10.0 | 7.0 to 20.0 | 0 to 40 | – |
| Batteries or other electricity storage | 17 | 11.0 | 10.0 to 25.0 | 0 to 100 | – |
By Task 52 affiliation (groups of at least 5)
- Subtask An=12Hydrogen storage (pipes, tanks, caverns) 25
- Industry and policy referencen=6Electrolyser modulation 28
What is the lowest iron content of pellet feed that a hydrogen shaft furnace will use economically by 2030, assuming an electric smelting furnace or adapted EAF downstream?
DR-grade pellets today are 67% Fe or better; blast-furnace-grade pellets are typically 62 to 65% Fe.
Mean score 64.5, median 63.5 · Self-rated confidence: mean 3.8 of 5
| Option | Experts | Share |
|---|---|---|
| 67% Fe or better only (DR-grade) | 2 | 8% |
| 65 to 67% Fe | 9 | 38% |
| 62 to 65% Fe | 11 | 46% |
| Below 62% Fe | 2 | 8% |
By Task 52 affiliation (groups of at least 5)
- Subtask An=1662 to 65% Fe 63%
- Industry and policy referencen=565 to 67% Fe 60%
How feasible is each feed-flexibility capability at commercial scale by 2035?
| Row | n | Mean | Median | IQR |
|---|---|---|---|---|
| Varying the scrap-to-DRI ratio in the EAF with market prices | 21 | 4.48 | 4.0 | 4.0 to 5.0 |
| Accepting higher gangue with an electric smelting furnace | 21 | 3.76 | 4.0 | 3.0 to 4.0 |
| Switching pellet suppliers without process changes | 21 | 3.57 | 4.0 | 3.0 to 5.0 |
| Running on magnetite concentrates as well as hematite | 20 | 3.55 | 3.5 | 3.0 to 4.0 |
| Blending DR-grade and BF-grade pellets on the fly | 21 | 3.52 | 4.0 | 3.0 to 4.0 |
| Using fines directly in fluidised-bed reduction | 18 | 3.44 | 4.0 | 3.0 to 4.0 |
| Charging lump ore alongside pellets in a hydrogen shaft furnace | 20 | 3.35 | 3.0 | 2.8 to 4.0 |
By Task 52 affiliation (groups of at least 5)
- Subtask An=14Varying the scrap-to-DRI ratio in the EAF with market prices 4.4
How will most hydrogen-ready DRI plants use their reductant flexibility in 2035? Rank the three most likely modes of operation, most likely first.
Borda score as a share of the maximum (rank 1 = 3 points, rank 3 = 1 point) · share ranking it first.
| Option | Borda share | Ranked first | Mentioned |
|---|---|---|---|
| Run mostly on natural gas with hydrogen used only when subsidised | 56% | 37% | 67% |
| Vary the hydrogen share seasonally or by contract period | 53% | 19% | 89% |
| Run a fixed hydrogen-natural gas blend set by certification thresholds | 37% | 11% | 63% |
| Run on hydrogen only; natural gas kept for start-up and back-up | 31% | 22% | 44% |
| Switch between hydrogen and natural gas from hour to hour with prices | 23% | 11% | 37% |
By Task 52 affiliation (groups of at least 5)
- Subtask An=17Vary the hydrogen share seasonally or by contract period (Borda 57%)
- Industry and policy referencen=7Run mostly on natural gas with hydrogen used only when subsidised (Borda 67%)
Rank the three forms of flexibility that will matter most for the competitiveness of hydrogen-based ironmaking.
Borda score as a share of the maximum (rank 1 = 3 points, rank 3 = 1 point) · share ranking it first.
| Option | Borda share | Ranked first | Mentioned |
|---|---|---|---|
| Locational flexibility (moving reduction to where power is cheap) | 49% | 36% | 57% |
| Ore grade and feed flexibility | 45% | 21% | 75% |
| Hydrogen and natural-gas reductant switching | 40% | 21% | 57% |
| Electrical load flexibility (turndown and ramping) | 32% | 11% | 50% |
| Scrap-ratio flexibility in the EAF | 15% | 7% | 21% |
| Output and inventory flexibility (stockpiling HBI) | 10% | 0% | 21% |
| Product flexibility (hot DRI, HBI, hot metal via ESF) | 8% | 4% | 18% |
By Task 52 affiliation (groups of at least 5)
- Subtask An=16Ore grade and feed flexibility (Borda 58%)
- Industry and policy referencen=8Hydrogen and natural-gas reductant switching (Borda 63%)
For new hydrogen DRI plants powered substantially by variable renewables, which electrolyser-integration architecture will be more common by 2032?
| Option | Experts | Share |
|---|---|---|
| Electrolysers directly coupled to renewable generation; the DRI plant absorbs the variability | 1 | 4% |
| Battery buffering of electrolyser output to smooth hydrogen production | 5 | 21% |
| Hydrogen storage between electrolyser and DRI plant | 9 | 38% |
| Grid-connected electrolysers running near-continuously, decoupled from on-site renewables | 9 | 38% |
By Task 52 affiliation (groups of at least 5)
- Subtask An=14Hydrogen storage between electrolyser and DRI plant 43%
- Industry and policy referencen=7Hydrogen storage between electrolyser and DRI plant 43%
Resources, supply chains and infrastructure 37 experts · 16 questions
Allocate global hydrogen-based DRI/HBI production in 2040 across producing regions (percent, summing to 100).
Box: interquartile range · thick line: median · whiskers: min–max · number: median
| Option | n | Median | IQR | Range | Reference |
|---|---|---|---|---|---|
| Australia | 28 | 10.0 | 7.3 to 20.0 | 0 to 40 | – |
| Middle East and North Africa | 27 | 15.0 | 10.0 to 22.9 | 0 to 44 | – |
| Brazil and rest of Latin America | 25 | 10.0 | 5.0 to 11.1 | 0 to 26 | – |
| Sub-Saharan Africa | 17 | 5.0 | 1.0 to 5.0 | 0 to 11 | – |
| China | 28 | 20.5 | 14.8 to 32.0 | 5 to 64 | – |
| India | 23 | 6.0 | 4.0 to 13.5 | 0 to 21 | – |
| Japan, Korea and South-East Asia | 23 | 5.0 | 2.5 to 10.2 | 0 to 20 | – |
| Europe | 28 | 11.6 | 6.5 to 25.0 | 0 to 75 | – |
| North America | 26 | 10.0 | 5.1 to 10.0 | 0 to 25 | – |
| Other regions | 17 | 1.0 | 0.0 to 5.0 | 0 to 11 | – |
By Task 52 affiliation (groups of at least 5)
- Subtask An=9China 21
- Subtask Bn=11Middle East and North Africa 17
- Industry and policy referencen=5Middle East and North Africa 35
What share of today's seaborne iron ore trade (by mass) can be economically upgraded to DR-grade feed (67% Fe or better, low gangue) by 2035?
Mean score 17.8, median 17.5 · Self-rated confidence: mean 3.1 of 5
| Option | Experts | Share |
|---|---|---|
| Less than 10% | 9 | 33% |
| 10 to 25% | 12 | 44% |
| 25 to 50% | 6 | 22% |
| More than 50% | 0 | 0% |
By Task 52 affiliation (groups of at least 5)
- Subtask An=910 to 25% 78%
- Subtask Bn=11Less than 10% 55%
Rank the three tightest bottlenecks for a first 2 Mt/yr green iron export project in a best-in-class location.
Borda score as a share of the maximum (rank 1 = 3 points, rank 3 = 1 point) · share ranking it first.
| Option | Borda share | Ranked first | Mentioned |
|---|---|---|---|
| Cost of firmed renewable electricity | 50% | 26% | 74% |
| Offtake certainty | 45% | 26% | 59% |
| Finance and cost of capital | 39% | 15% | 62% |
| Electrolyser cost and delivery | 23% | 12% | 32% |
| DR-grade ore or beneficiation capacity | 19% | 9% | 29% |
| Transmission and grid connection | 19% | 12% | 29% |
| Port, HBI handling and shipping | 5% | 0% | 12% |
| Water supply | 1% | 0% | 3% |
| Permitting, land access and community consent | 0% | 0% | 0% |
| Skilled workforce and housing | 0% | 0% | 0% |
By Task 52 affiliation (groups of at least 5)
- Subtask An=9Finance and cost of capital (Borda 56%)
- Subtask Bn=13Cost of firmed renewable electricity (Borda 51%)
- Industry and policy referencen=7Offtake certainty (Borda 62%)
How important is public or shared investment in each type of infrastructure for green iron hubs?
| Row | n | Mean | Median | IQR |
|---|---|---|---|---|
| High-voltage transmission | 25 | 4.32 | 5.0 | 4.0 to 5.0 |
| Hydrogen pipelines and storage | 24 | 4.29 | 4.0 | 4.0 to 5.0 |
| Water supply and desalination | 26 | 3.92 | 4.0 | 3.3 to 4.8 |
| Port and HBI handling facilities | 26 | 3.69 | 4.0 | 3.0 to 4.0 |
| Rail and ore logistics | 26 | 3.42 | 4.0 | 2.3 to 4.0 |
| Common-user industrial precincts | 26 | 3.12 | 3.0 | 2.3 to 4.0 |
| Pellet and beneficiation plants | 25 | 2.80 | 3.0 | 2.0 to 3.0 |
| Workforce housing and services | 26 | 2.50 | 3.0 | 2.0 to 3.0 |
By Task 52 affiliation (groups of at least 5)
- Subtask An=9Hydrogen pipelines and storage 4.4
- Subtask Bn=11Hydrogen pipelines and storage 4.6
By 2035, most new hydrogen-based iron capacity will be built in vertically integrated hubs that co-locate ore, renewable electricity, hydrogen and DRI, rather than in disaggregated configurations.
Mean score 0.7, median 1.0
| Option | Experts | Share |
|---|---|---|
| Strongly disagree | 0 | 0% |
| Disagree | 3 | 9% |
| Neutral | 10 | 30% |
| Agree | 14 | 42% |
| Strongly agree | 6 | 18% |
By Task 52 affiliation (groups of at least 5)
- Subtask An=9Agree 33%
- Subtask Bn=12Neutral 42%
- Industry and policy referencen=7Agree 71%
Which green iron trade corridors will carry the largest volumes in 2040? Select up to three.
Share of respondents selecting each option.
| Option | Experts | Share selecting |
|---|---|---|
| Middle East and North Africa to Europe | 18 | 60% |
| Australia to China | 15 | 50% |
| Australia to Japan and Korea | 13 | 43% |
| Mostly domestic within China | 12 | 40% |
| Brazil to Europe | 8 | 27% |
| Middle East to South and East Asia | 7 | 23% |
| Australia to Europe | 5 | 17% |
| Brazil to North-East Asia | 4 | 13% |
| Mostly domestic within India | 3 | 10% |
| Sub-Saharan Africa to Europe | 0 | 0% |
| Canada to Europe | 0 | 0% |
By Task 52 affiliation (groups of at least 5)
- Subtask An=9Middle East and North Africa to Europe 78%
- Subtask Bn=11Australia to China 64%
- Industry and policy referencen=6Australia to Japan and Korea 50%
How much hydrogen-based merchant iron (DRI/HBI) will be traded internationally in 2035?
Today's total merchant DRI/HBI trade, almost all natural-gas based, is roughly 20 to 25 million tonnes per year.
Median low
15.0
Median best
35.0
IQR 12.5–60.0
Median high
61.5
One line per expert (lowest to highest plausible), dot: best estimate, sorted by best estimate · shaded band: interquartile range of best estimates · dashed: median
Unit: million tonnes per year of merchant DRI/HBI
| Estimate | n | Median | IQR | Range | Mean |
|---|---|---|---|---|---|
| Lowest plausible | 24 | 15 | 6 to 32 | 0 to 240 | 31.8 |
| Best estimate | 24 | 35 | 13 to 60 | 4 to 300 | 55.5 |
| Highest plausible | 24 | 62 | 24 to 108 | 10 to 300 | 88.4 |
By Task 52 affiliation (groups of at least 5)
- Subtask An=7best 50 million tonnes per year of merchant DRI/HBI
- Subtask Bn=9best 36 million tonnes per year of merchant DRI/HBI
- Industry and policy referencen=5best 5 million tonnes per year of merchant DRI/HBI
How much will each factor drive where new hydrogen-based iron capacity is located over the next decade?
| Row | n | Mean | Median | IQR |
|---|---|---|---|---|
| Cost of firmed renewable electricity | 32 | 4.72 | 5.0 | 4.0 to 5.0 |
| Political and trade risk | 30 | 4.20 | 4.0 | 3.3 to 5.0 |
| Capital and operating subsidies | 32 | 4.13 | 4.0 | 4.0 to 5.0 |
| Carbon pricing and border adjustment exposure | 31 | 3.90 | 4.0 | 3.0 to 5.0 |
| Access to low-cost natural gas as a bridge | 31 | 3.77 | 4.0 | 3.0 to 5.0 |
| Proximity to green steel demand and offtakers | 32 | 3.56 | 3.5 | 3.0 to 4.0 |
| Port access and shipping distance to markets | 30 | 3.53 | 3.5 | 3.0 to 4.0 |
| Water, land and permitting | 31 | 3.52 | 4.0 | 3.0 to 4.0 |
| Proximity to suitable iron ore | 31 | 3.45 | 4.0 | 3.0 to 4.0 |
| Existing steel plants and skilled workforce | 31 | 2.97 | 3.0 | 2.0 to 4.0 |
By Task 52 affiliation (groups of at least 5)
- Subtask An=9Cost of firmed renewable electricity 4.8
- Subtask Bn=12Cost of firmed renewable electricity 4.8
- Industry and policy referencen=6Cost of firmed renewable electricity 4.5
In 2030, what will be the gap between the DR-grade pellet demand of DRI plants then in commercial operation and the DR-grade pellet supply actually available, merchant plus captive?
Published estimates range from a 16.5 Mt shortfall by 2034 (Midrex) to 133 Mt by 2040 (BloombergNEF); merchant DR-grade supply was roughly 48 Mt in 2025.
Median low
10.0
Median best
25.0
IQR 16.3–53.8
Median high
62.5
One line per expert (lowest to highest plausible), dot: best estimate, sorted by best estimate · shaded band: interquartile range of best estimates · dashed: median
Unit: Mt per year of DR-grade pellets
| Estimate | n | Median | IQR | Range | Mean |
|---|---|---|---|---|---|
| Lowest plausible | 16 | 10 | 0 to 16 | 0 to 92 | 16.6 |
| Best estimate | 16 | 25 | 16 to 54 | 0 to 100 | 35.4 |
| Highest plausible | 16 | 63 | 29 to 100 | 2 to 150 | 62.1 |
By Task 52 affiliation (groups of at least 5)
- Subtask An=6best 25 Mt per year of DR-grade pellets
- Subtask Bn=6best 30 Mt per year of DR-grade pellets
If global high-grade ore supply grew substantially by 2030 (say an additional 100 Mt per year of ore above 65% Fe), how would that affect the availability of DR-grade feed for hydrogen-based ironmaking?
Assume the additional ore still needs beneficiation or pelletising to meet DR-grade specification; high-grade fines are not automatically DR-grade feed.
| Option | Experts | Share |
|---|---|---|
| Materially eases DR-grade feed availability | 7 | 24% |
| Modest easing | 8 | 28% |
| Little change: high-grade fines mostly displace blast-furnace feed | 3 | 10% |
| Availability still tightens as DR-grade demand grows faster than qualified supply | 4 | 14% |
| Depends mainly on beneficiation and pelletising capacity | 7 | 24% |
By Task 52 affiliation (groups of at least 5)
- Subtask An=9Modest easing 33%
- Subtask Bn=12Depends mainly on beneficiation and pelletising capacity 33%
Which ore pathway will supply most of the world's traded green iron tonnage by 2035?
| Option | Experts | Share |
|---|---|---|
| Magnetite beneficiated to DR-grade pellets, fed to shaft-furnace hydrogen DRI | 20 | 71% |
| Hematite fines or lump via an electric smelting furnace, without full beneficiation | 2 | 7% |
| Roughly even split between the two | 3 | 11% |
| Neither; global green iron trade stays below 5 Mt per year in 2035 | 3 | 11% |
By Task 52 affiliation (groups of at least 5)
- Subtask An=9Magnetite beneficiated to DR-grade pellets, fed to shaft-furnace hydrogen DRI 67%
- Subtask Bn=11Magnetite beneficiated to DR-grade pellets, fed to shaft-furnace hydrogen DRI 64%
What is the probability that by 2035 more than half of global DRI output is made from ore that is below 65% Fe as mined, before beneficiation, whether the ore is upgraded to DR grade by beneficiation or used at lower grade with an electric smelter downstream?
0% means certain not to, 100% means certain. Today almost all DRI uses reactor feed of 67% Fe or more, most of it from ore that was already high grade as mined.
Dot: median · bar: interquartile range
| Row | n | Median % | IQR % | Range % |
|---|---|---|---|---|
| More than half of global DRI output from ore below 65% Fe by 2035 | 27 | 40 | 23 to 58 | 5 to 95 |
By Task 52 affiliation (groups of at least 5)
- Subtask An=9More than half of global DRI output from ore below 65% Fe by 2035 35%
- Subtask Bn=10More than half of global DRI output from ore below 65% Fe by 2035 50%
- Industry and policy referencen=5More than half of global DRI output from ore below 65% Fe by 2035 20%
For feed charged to a shaft furnace as DR pellets or lump ore, below what Fe grade of that feed can the plant no longer operate commercially without further upgrading?
Give the Fe grade of the feed as charged (pellets or lump), not of the ore as mined. Lowest and highest plausible first, then your best estimate.
Median low
61.0
Median best
65.0
IQR 62.0–65.0
Median high
67.0
One line per expert (lowest to highest plausible), dot: best estimate, sorted by best estimate · shaded band: interquartile range of best estimates · dashed: median
Unit: % Fe
| Estimate | n | Median | IQR | Range | Mean |
|---|---|---|---|---|---|
| Lowest plausible | 17 | 61.0 | 55.0 to 62.0 | 50.0 to 66.0 | 59.38 |
| Best estimate | 17 | 65.0 | 62.0 to 65.0 | 60.0 to 67.0 | 63.56 |
| Highest plausible | 17 | 67.0 | 65.0 to 68.0 | 64.5 to 70.0 | 66.85 |
By Task 52 affiliation (groups of at least 5)
- Subtask An=8best 62.8% Fe
- Subtask Bn=5best 65.0% Fe
What is the cost premium for producing DR-grade pellets, in US dollars per tonne of pellets?
Per dry tonne of pellets produced. Include grinding, beneficiation to DR-grade chemistry and pelletising; exclude mining and transport. Compare with producing sinter feed or fines from the same ore at a best-in-class location.
Median low
20.0
Median best
35.0
IQR 28.5–50.0
Median high
52.5
One line per expert (lowest to highest plausible), dot: best estimate, sorted by best estimate · shaded band: interquartile range of best estimates · dashed: median
Unit: USD per tonne of pellets
| Estimate | n | Median | IQR | Range | Mean |
|---|---|---|---|---|---|
| Lowest plausible | 18 | 20 | 19 to 29 | 0 to 50 | 24.1 |
| Best estimate | 18 | 35 | 29 to 50 | 15 to 80 | 38.8 |
| Highest plausible | 18 | 53 | 40 to 74 | 25 to 100 | 57.8 |
By Task 52 affiliation (groups of at least 5)
- Subtask An=6best 35 USD per tonne of pellets
- Subtask Bn=6best 33 USD per tonne of pellets
How serious a constraint will each of these be on global hydrogen-based ironmaking and EAF capacity additions between 2026 and 2032?
| Row | n | Mean | Median | IQR |
|---|---|---|---|---|
| Electrolyser manufacturing capacity and delivery times | 24 | 3.63 | 3.0 | 3.0 to 5.0 |
| High-voltage transformers and grid equipment | 24 | 3.63 | 4.0 | 3.0 to 4.3 |
| Shaft-furnace and DRI-plant EPC and equipment capacity | 25 | 3.48 | 4.0 | 3.0 to 4.0 |
| Electric smelting furnace equipment availability | 25 | 3.36 | 3.0 | 3.0 to 4.0 |
| Specialist engineering and construction labour | 25 | 3.16 | 3.0 | 3.0 to 4.0 |
| EAF graphite electrode and needle-coke supply | 22 | 3.00 | 3.0 | 2.0 to 4.0 |
By Task 52 affiliation (groups of at least 5)
- Subtask An=8Shaft-furnace and DRI-plant EPC and equipment capacity 3.9
- Subtask Bn=8High-voltage transformers and grid equipment 3.9
In which year will a liquid merchant market for hydrogen-based HBI exist, with multiple independent buyers and sellers and cargoes routinely traded against a published price benchmark?
Comparable in market structure, not volume, to today's seaborne iron ore market. Fill the 10% and 90% years first.
10% chance by
2034
IQR 2030–2035
50% chance by
2040
IQR 2037–2042
90% chance by
2048
IQR 2041–2050
Pooled cumulative probability: average of each expert's piecewise-linear curve through their 10%, 50% and 90% years.
| Percentile | n | Median year | IQR | Range | “Never” |
|---|---|---|---|---|---|
| 10% chance by | 22 | 2034 | 2030 to 2035 | 2028 to 2055 | 0 |
| 50% chance by | 22 | 2040 | 2037 to 2042 | 2032 to 2055 | 0 |
| 90% chance by | 22 | 2048 | 2041 to 2050 | 2035 to 2055 | 0 |
By Task 52 affiliation (groups of at least 5)
- Subtask An=850% chance by 2040
- Subtask Bn=650% chance by 2039
- Industry and policy referencen=550% chance by 2040
Projects, finance and offtake 26 experts · 6 questions
What cost of debt will a first-of-a-kind 2 Mt per year hydrogen DRI project with no operating track record face at final investment decision in 2026 or 2027, without government guarantees?
BCG analysis cited in 2026 reporting found green hydrogen project debt costs more than three times that of mature renewables.
Median low
6.5
Median best
9.0
IQR 8.0–12.6
Median high
15.0
One line per expert (lowest to highest plausible), dot: best estimate, sorted by best estimate · shaded band: interquartile range of best estimates · dashed: median
Unit: % per year, cost of debt
| Estimate | n | Median | IQR | Range | Mean |
|---|---|---|---|---|---|
| Lowest plausible | 12 | 6.5 | 4.5 to 8.3 | 3.0 to 10.0 | 6.52 |
| Best estimate | 12 | 9.0 | 8.0 to 12.6 | 3.0 to 20.0 | 10.27 |
| Highest plausible | 12 | 15.0 | 12.0 to 15.8 | 4.0 to 20.0 | 14.04 |
Rank the three financing or risk-sharing mechanisms that would most increase the number of hydrogen-based iron and steel projects reaching final investment decision by 2029.
Borda score as a share of the maximum (rank 1 = 3 points, rank 3 = 1 point) · share ranking it first.
| Option | Borda share | Ranked first | Mentioned |
|---|---|---|---|
| Government offtake or revenue-support contracts (carbon contracts for difference) | 76% | 62% | 86% |
| Buyer-backed offtake agreements usable as loan collateral | 43% | 19% | 62% |
| Direct capital grants or public equity co-investment | 33% | 14% | 52% |
| Sovereign or strategic-investor equity stakes | 17% | 5% | 33% |
| Multilateral development bank guarantees or first-loss capital | 8% | 0% | 19% |
| Blended or concessional finance from climate funds | 8% | 0% | 14% |
| Export credit agency-backed debt | 6% | 0% | 14% |
| Insurance covering technology or completion risk | 6% | 0% | 14% |
| Green or sustainability-linked bond markets | 2% | 0% | 5% |
By Task 52 affiliation (groups of at least 5)
- Subtask An=5Government offtake or revenue-support contracts (carbon contracts for difference) (Borda 60%)
- Subtask Bn=5Government offtake or revenue-support contracts (carbon contracts for difference) (Borda 80%)
- Industry and policy referencen=6Government offtake or revenue-support contracts (carbon contracts for difference) (Borda 72%)
In a typical hydrogen DRI project financing today, which party bears most of each risk?
| Row | n | Project sponsor or equity | Government support scheme | Buyer, via offtake terms | Lender or debt | Largely unallocated or uninsured |
|---|---|---|---|---|---|---|
| Offtake and demand risk | 15 | 53% | 7% | 33% | 7% | 0% |
| Hydrogen and electricity price risk | 15 | 60% | 7% | 7% | 0% | 27% |
| Technology and completion risk | 14 | 71% | 14% | 0% | 7% | 7% |
| Policy durability risk, such as subsidy or contract survival | 15 | 47% | 27% | 7% | 0% | 20% |
| Political and cross-border trade risk | 15 | 40% | 27% | 13% | 0% | 20% |
By Task 52 affiliation (groups of at least 5)
- Industry and policy referencen=5Offtake and demand risk: Project sponsor or equity 40%
Based on dated, publicly reported assessments, what premium do you judge is typical in 2026 for near-zero or low-emission steel, by buyer segment?
Use published assessments only (for example, Fastmarkets' published European green flat-steel premium assessment of roughly EUR 125 per tonne in early 2026). Do not use your own or a counterparty's contract terms.
| Row | n | No premium | Up to USD 50/t | USD 50 to 120/t | USD 120 to 200/t | More than USD 200/t |
|---|---|---|---|---|---|---|
| Automotive OEM long-term contracts | 13 | 8% | 15% | 31% | 46% | 0% |
| Construction and infrastructure | 13 | 46% | 38% | 8% | 8% | 0% |
| Wind and renewable-equipment manufacturers | 10 | 30% | 20% | 30% | 20% | 0% |
| Appliance and consumer goods | 11 | 18% | 36% | 27% | 18% | 0% |
| Spot market, service centres and stockholders | 11 | 55% | 18% | 18% | 9% | 0% |
By Task 52 affiliation (groups of at least 5)
- Subtask An=5Automotive OEM long-term contracts: USD 50 to 120/t 60%
By 2030, which contract structure will be most common for large-volume green iron and steel offtake agreements of 250,000 tonnes per year or more? Rank the three you expect to be most common, most common first.
Borda score as a share of the maximum (rank 1 = 3 points, rank 3 = 1 point) · share ranking it first.
| Option | Borda share | Ranked first | Mentioned |
|---|---|---|---|
| Fixed premium over a benchmark index for the contract life | 53% | 33% | 67% |
| Government contract for difference covers the gap; buyer pays the reference price | 40% | 13% | 60% |
| No standard structure; deals stay bespoke | 33% | 27% | 47% |
| Cost-plus pass-through of the seller's input costs | 29% | 13% | 47% |
| Premium indexed to a published green-steel price assessment | 27% | 13% | 40% |
| Floor and ceiling collar around an index | 18% | 0% | 40% |
By Task 52 affiliation (groups of at least 5)
- Subtask An=5Fixed premium over a benchmark index for the contract life (Borda 53%)
Of new hydrogen-based DRI capacity reaching commercial operation worldwide between 2026 and 2035, what share will be brownfield conversions of existing integrated steelworks rather than greenfield builds?
Mean score 32.4, median 30.0
| Option | Experts | Share |
|---|---|---|
| Less than 20% brownfield; greenfield dominates | 6 | 32% |
| 20 to 40% brownfield | 6 | 32% |
| 40 to 60%, roughly even | 6 | 32% |
| More than 60% brownfield; conversion dominates | 1 | 5% |
By Task 52 affiliation (groups of at least 5)
- Subtask An=540 to 60%, roughly even 40%
- Industry and policy referencen=6Less than 20% brownfield; greenfield dominates 33%
Pathways, competitiveness and power systems 42 experts · 16 questions
What production-cost premium will domestic hydrogen-based DRI-EAF crude steel carry over BF-BOF in Europe and in China, excluding carbon pricing and subsidies?
| Row | n | Below BF-BOF cost | 0 to 10% | 10 to 25% | 25 to 50% | Above 50% |
|---|---|---|---|---|---|---|
| Europe, 2030 | 32 | 0% | 9% | 6% | 47% | 38% |
| Europe, 2035 | 32 | 0% | 9% | 31% | 44% | 16% |
| China, 2030 | 29 | 0% | 7% | 31% | 52% | 10% |
| China, 2035 | 29 | 0% | 24% | 45% | 28% | 3% |
By Task 52 affiliation (groups of at least 5)
- Subtask Bn=5Europe, 2030: 25 to 50% 60%
- Subtask Cn=12Europe, 2030: Above 50% 58%
- Linkage and exchangen=7Europe, 2030: 25 to 50% 86%
What carbon price would make hydrogen-based DRI-EAF steel cost-competitive with unabated BF-BOF in Europe in 2030, without other subsidies?
Median low
110.0
Median best
165.0
IQR 141.3–200.0
Median high
232.5
One line per expert (lowest to highest plausible), dot: best estimate, sorted by best estimate · shaded band: interquartile range of best estimates · dashed: median
Unit: USD per tonne CO2
| Estimate | n | Median | IQR | Range | Mean |
|---|---|---|---|---|---|
| Lowest plausible | 30 | 110 | 93 to 150 | 60 to 200 | 118.0 |
| Best estimate | 30 | 165 | 141 to 200 | 90 to 250 | 172.0 |
| Highest plausible | 30 | 233 | 200 to 290 | 150 to 400 | 240.2 |
By Task 52 affiliation (groups of at least 5)
- Subtask Cn=12best 185 USD per tonne CO2
- Linkage and exchangen=6best 130 USD per tonne CO2
What will low-emission hydrogen cost, delivered to a DRI plant in a best-in-class location, in 2035?
Include production, storage and buffering needed for continuous DRI operation.
Median low
2.0
Median best
3.0
IQR 2.5–4.4
Median high
4.8
One line per expert (lowest to highest plausible), dot: best estimate, sorted by best estimate · shaded band: interquartile range of best estimates · dashed: median
Unit: USD per kg hydrogen
| Estimate | n | Median | IQR | Range | Mean |
|---|---|---|---|---|---|
| Lowest plausible | 34 | 2.0 | 1.6 to 2.8 | 1.0 to 10.0 | 2.71 |
| Best estimate | 34 | 3.0 | 2.5 to 4.4 | 1.2 to 10.0 | 3.94 |
| Highest plausible | 34 | 4.8 | 3.9 to 6.7 | 1.5 to 10.0 | 5.35 |
By Task 52 affiliation (groups of at least 5)
- Subtask Bn=5best 3.0 USD per kg hydrogen
- Subtask Cn=12best 2.9 USD per kg hydrogen
- Linkage and exchangen=7best 2.8 USD per kg hydrogen
- Industry and policy referencen=5best 6.0 USD per kg hydrogen
What is the probability that each milestone is reached by the end of 2030?
0% means impossible, 100% means certain.
Dot: median · bar: interquartile range
| Row | n | Median % | IQR % | Range % |
|---|---|---|---|---|
| China has three or more hydrogen shaft furnaces of 1 Mt/yr or larger operating | 29 | 70 | 50 to 80 | 5 to 100 |
| EU CBAM applies to iron and steel at full strength without major derogations | 30 | 45 | 25 to 70 | 0 to 100 |
| A near-zero steel definition is mutually recognised by the EU, Japan and Korea | 28 | 45 | 18 to 60 | 5 to 80 |
| At least 10 Mt/yr of hydrogen-based DRI capacity operating globally | 34 | 25 | 11 to 50 | 0 to 85 |
| A commercial-scale hydrogen-based DRI plant is operating in North America | 28 | 20 | 10 to 31 | 0 to 80 |
| At least 5 Mt/yr of green iron traded between continents | 33 | 25 | 10 to 35 | 0 to 100 |
By Task 52 affiliation (groups of at least 5)
- Subtask Cn=12China has three or more hydrogen shaft furnaces of 1 Mt/yr or larger operating 78%
- Linkage and exchangen=7China has three or more hydrogen shaft furnaces of 1 Mt/yr or larger operating 60%
- Industry and policy referencen=5China has three or more hydrogen shaft furnaces of 1 Mt/yr or larger operating 63%
What share of Europe's primary iron units for near-zero steel will be imported as HBI or DRI in 2040, rather than reduced in Europe?
Mean score 32.8, median 37.5 · Self-rated confidence: mean 3.0 of 5
| Option | Experts | Share |
|---|---|---|
| Less than 10% | 2 | 6% |
| 10 to 25% | 13 | 39% |
| 25 to 50% | 13 | 39% |
| 50 to 75% | 3 | 9% |
| More than 75% | 2 | 6% |
By Task 52 affiliation (groups of at least 5)
- Subtask Bn=525 to 50% 60%
- Subtask Cn=1225 to 50% 50%
- Linkage and exchangen=610 to 25% 50%
- Industry and policy referencen=510 to 25% 40%
How important is each power-system issue for hydrogen-based ironmaking at multi-million-tonne scale?
| Row | n | Mean | Median | IQR |
|---|---|---|---|---|
| Cost of firming variable renewables | 30 | 4.30 | 4.5 | 4.0 to 5.0 |
| Electricity market design and industrial tariffs | 29 | 4.14 | 4.0 | 4.0 to 5.0 |
| Grid connection lead times | 29 | 3.90 | 4.0 | 3.0 to 5.0 |
| Large-scale hydrogen storage | 32 | 3.78 | 4.0 | 3.0 to 4.3 |
| Transmission build-out | 31 | 3.77 | 4.0 | 3.0 to 4.5 |
| Flexible electrolyser operation | 32 | 3.72 | 4.0 | 3.0 to 5.0 |
| DRI plant turndown and ramping | 31 | 3.03 | 3.0 | 3.0 to 4.0 |
| Value of DRI plants as flexible demand for the grid | 29 | 2.97 | 3.0 | 2.0 to 4.0 |
By Task 52 affiliation (groups of at least 5)
- Subtask Cn=12Electricity market design and industrial tariffs 4.1
- Linkage and exchangen=5Electricity market design and industrial tariffs 4.2
- Industry and policy referencen=6Cost of firming variable renewables 4.6
How effective will each policy instrument be at sustaining hydrogen-based steelmaking after 2030, once first plants are built?
| Row | n | Mean | Median | IQR |
|---|---|---|---|---|
| Domestic carbon pricing | 32 | 4.06 | 4.0 | 3.8 to 5.0 |
| Border carbon adjustment | 32 | 4.06 | 4.0 | 4.0 to 5.0 |
| Carbon contracts for difference | 30 | 3.97 | 4.0 | 3.3 to 5.0 |
| Product standards and embodied-carbon limits | 32 | 3.75 | 4.0 | 3.0 to 4.0 |
| Lead markets and quotas | 32 | 3.72 | 4.0 | 3.0 to 4.0 |
| Hydrogen subsidies | 33 | 3.67 | 4.0 | 3.0 to 4.0 |
| Green iron trade agreements | 33 | 3.61 | 4.0 | 3.0 to 4.0 |
| Green public procurement | 32 | 3.53 | 3.0 | 3.0 to 4.0 |
| Plurilateral clubs and sectoral agreements | 32 | 3.19 | 3.0 | 3.0 to 4.0 |
By Task 52 affiliation (groups of at least 5)
- Subtask Bn=5Carbon contracts for difference 4.5
- Subtask Cn=11Domestic carbon pricing 4.5
- Linkage and exchangen=7Border carbon adjustment 4.3
- Industry and policy referencen=5Border carbon adjustment 3.8
Rank the three parameters that contribute most to uncertainty in the 2035 cost of hydrogen-based steel.
Borda score as a share of the maximum (rank 1 = 3 points, rank 3 = 1 point) · share ranking it first.
| Option | Borda share | Ranked first | Mentioned |
|---|---|---|---|
| Renewable electricity price and firming | 71% | 58% | 81% |
| Green premium buyers will pay | 29% | 11% | 44% |
| Carbon price and CBAM | 26% | 14% | 36% |
| Electrolyser capex and efficiency | 21% | 0% | 39% |
| Natural gas price of the competing route | 16% | 6% | 31% |
| Cost of capital | 12% | 6% | 19% |
| Plant utilisation and flexibility costs | 12% | 6% | 22% |
| DR-grade ore premium | 10% | 0% | 22% |
| DRI and EAF plant capex | 3% | 0% | 6% |
By Task 52 affiliation (groups of at least 5)
- Subtask Bn=5Renewable electricity price and firming (Borda 87%)
- Subtask Cn=13Renewable electricity price and firming (Borda 72%)
- Linkage and exchangen=7Renewable electricity price and firming (Borda 67%)
- Industry and policy referencen=6Renewable electricity price and firming (Borda 56%)
In which year will hydrogen-based DRI-EAF crude steel made in Europe become cheaper than unabated BF-BOF steel in Europe, including carbon pricing and border adjustment but excluding subsidies?
Give the year by which you assign a 10%, 50% and 90% chance. Fill the 10% and 90% years first.
10% chance by
2033
IQR 2031–2035
50% chance by
2040
IQR 2037–2043
90% chance by
2048
IQR 2044–2050
Pooled cumulative probability: average of each expert's piecewise-linear curve through their 10%, 50% and 90% years.
| Percentile | n | Median year | IQR | Range | “Never” |
|---|---|---|---|---|---|
| 10% chance by | 27 | 2033 | 2031 to 2035 | 2027 to 2042 | 0 |
| 50% chance by | 27 | 2040 | 2037 to 2043 | 2028 to 2055 | 0 |
| 90% chance by | 27 | 2048 | 2044 to 2050 | 2030 to 2055 | 0 |
By Task 52 affiliation (groups of at least 5)
- Subtask Cn=1150% chance by 2040
- Linkage and exchangen=650% chance by 2038
What will global crude steel demand be in 2050, all routes and regions?
Published scenarios differ by more than 200 Mt: IEA Net Zero around 1,960 Mt after material-efficiency savings, Agora Industry around 2,175 Mt; 2025 demand is about 1,750 Mt.
Median low
1800.0
Median best
2025.0
IQR 1905.0–2200.0
Median high
2315.0
One line per expert (lowest to highest plausible), dot: best estimate, sorted by best estimate · shaded band: interquartile range of best estimates · dashed: median
Unit: Mt per year of crude steel
| Estimate | n | Median | IQR | Range | Mean |
|---|---|---|---|---|---|
| Lowest plausible | 30 | 1800 | 1625 to 1908 | 1200 to 2400 | 1759.3 |
| Best estimate | 30 | 2025 | 1905 to 2200 | 1200 to 2600 | 2035.7 |
| Highest plausible | 30 | 2315 | 2200 to 2500 | 1200 to 2800 | 2291.0 |
By Task 52 affiliation (groups of at least 5)
- Subtask Bn=5best 2000 Mt per year of crude steel
- Subtask Cn=12best 2050 Mt per year of crude steel
- Linkage and exchangen=7best 2000 Mt per year of crude steel
What will the average delivered price of firmed, near-continuous renewable electricity be for a large flexible industrial user such as a green iron plant in 2030, in each region?
| Row | n | Below USD 30/MWh | 30 to 50 | 50 to 70 | 70 to 100 | Above USD 100/MWh |
|---|---|---|---|---|---|---|
| Europe, best-in-class site | 21 | 10% | 38% | 19% | 24% | 10% |
| Australia, best-in-class site | 20 | 35% | 15% | 30% | 15% | 5% |
| Middle East and North Africa | 20 | 35% | 45% | 15% | 0% | 5% |
| United States | 19 | 16% | 47% | 26% | 5% | 5% |
| China | 21 | 43% | 38% | 5% | 10% | 5% |
| India | 19 | 32% | 21% | 37% | 5% | 5% |
By Task 52 affiliation (groups of at least 5)
- Subtask Cn=9Europe, best-in-class site: 50 to 70 38%
- Linkage and exchangen=5Europe, best-in-class site: 30 to 50 75%
What share of global hydrogen consumption will iron and steel production account for in 2035, all routes, including hydrogen used via ammonia?
Today iron and steel take roughly 5% of the world's hydrogen use of about 100 Mt per year, almost all of it in natural-gas DRI. Published studies cluster around 2050 endpoints; no comparable 2035 share exists, so the network's estimate fills a real gap.
Median low
6.0
Median best
11.0
IQR 10.0–18.5
Median high
20.0
One line per expert (lowest to highest plausible), dot: best estimate, sorted by best estimate · shaded band: interquartile range of best estimates · dashed: median
Unit: % of global hydrogen consumption
| Estimate | n | Median | IQR | Range | Mean |
|---|---|---|---|---|---|
| Lowest plausible | 24 | 6 | 5 to 11 | 0 to 44 | 10.2 |
| Best estimate | 24 | 11 | 10 to 19 | 2 to 55 | 17.3 |
| Highest plausible | 24 | 20 | 15 to 33 | 5 to 90 | 27.4 |
By Task 52 affiliation (groups of at least 5)
- Subtask Cn=8best 14% of global hydrogen consumption
- Linkage and exchangen=6best 11% of global hydrogen consumption
Which investments are least-regret for a steelmaker deciding today, meaning they hold value across most hydrogen-price and policy scenarios out to 2040? Rank your top three.
Borda score as a share of the maximum (rank 1 = 3 points, rank 3 = 1 point) · share ranking it first.
| Option | Borda share | Ranked first | Mentioned |
|---|---|---|---|
| Scrap-based EAF capacity and scrap sourcing | 75% | 61% | 89% |
| Grid connection and long-term renewable power contracts | 26% | 6% | 44% |
| Hydrogen-ready DRI started on natural gas | 25% | 8% | 39% |
| Long-term green-steel offtake contracts with buyers | 23% | 6% | 39% |
| Electric smelter (ESF/OSBF) capability for lower-grade ore | 13% | 6% | 22% |
| Keeping blast furnaces running with CCUS or hydrogen-injection readiness | 13% | 6% | 19% |
| Securing DR-grade ore or beneficiation capacity | 8% | 3% | 17% |
| Import agreements for green HBI or merchant iron | 8% | 3% | 14% |
| Deferring major capital decisions until after 2030 | 8% | 3% | 17% |
By Task 52 affiliation (groups of at least 5)
- Subtask Bn=5Scrap-based EAF capacity and scrap sourcing (Borda 67%)
- Subtask Cn=13Scrap-based EAF capacity and scrap sourcing (Borda 85%)
- Linkage and exchangen=7Scrap-based EAF capacity and scrap sourcing (Borda 81%)
- Industry and policy referencen=6Scrap-based EAF capacity and scrap sourcing (Borda 72%)
An existing integrated BF-BOF site in a high-cost jurisdiction faces a blast-furnace reline decision before 2032. Rank the three least-regret choices, least regret first.
Borda score as a share of the maximum (rank 1 = 3 points, rank 3 = 1 point) · share ranking it first.
| Option | Borda share | Ranked first | Mentioned |
|---|---|---|---|
| Depends entirely on the site; no general answer | 63% | 58% | 70% |
| Replace with EAF fed by scrap and imported HBI | 52% | 15% | 82% |
| Replace with hydrogen-ready natural-gas DRI and EAF | 24% | 6% | 48% |
| Retire the capacity and source slab or iron elsewhere | 23% | 6% | 39% |
| Reline unabated and decide later | 20% | 6% | 33% |
| Reline with hydrogen-injection or CCUS readiness | 18% | 9% | 27% |
By Task 52 affiliation (groups of at least 5)
- Subtask Cn=11Depends entirely on the site; no general answer (Borda 76%)
- Linkage and exchangen=7Replace with EAF fed by scrap and imported HBI (Borda 76%)
- Industry and policy referencen=6Depends entirely on the site; no general answer (Borda 83%)
How robust is each pathway if renewable hydrogen still costs more than USD 4 per kilogram in 2035?
| Row | n | Robust: still the right choice | Tolerable: viable with support | At risk of stranding |
|---|---|---|---|---|
| Hydrogen DRI at the existing steel site | 28 | 7% | 46% | 46% |
| Importing green HBI from ore-and-renewables hubs | 27 | 26% | 63% | 11% |
| Natural-gas DRI with CCS | 26 | 35% | 38% | 27% |
| Blast furnace with CCUS | 24 | 21% | 21% | 58% |
| Scrap-based EAF expansion | 27 | 85% | 15% | 0% |
| Electric smelter on lower-grade ore with hydrogen DRI | 25 | 16% | 48% | 36% |
By Task 52 affiliation (groups of at least 5)
- Subtask Cn=9Hydrogen DRI at the existing steel site: At risk of stranding 67%
- Linkage and exchangen=6Hydrogen DRI at the existing steel site: Tolerable: viable with support 50%
Which policy measures are least-regret, meaning they help the transition whichever technology route wins? Rank your top three.
Borda score as a share of the maximum (rank 1 = 3 points, rank 3 = 1 point) · share ranking it first.
| Option | Borda share | Ranked first | Mentioned |
|---|---|---|---|
| A rising, predictable carbon price | 65% | 56% | 72% |
| Lead markets: public procurement and quotas for near-zero steel | 29% | 8% | 50% |
| Grid build-out and faster connection for industrial loads | 26% | 8% | 47% |
| Border carbon adjustment on imported steel and iron | 24% | 6% | 39% |
| Hydrogen production and transport infrastructure | 16% | 11% | 19% |
| Common emissions accounting and product standards | 15% | 0% | 28% |
| Scrap retention and quality policies | 12% | 3% | 25% |
| Carbon contracts for difference | 11% | 6% | 17% |
| Research and demonstration funding | 3% | 3% | 3% |
By Task 52 affiliation (groups of at least 5)
- Subtask Bn=5A rising, predictable carbon price (Borda 40%)
- Subtask Cn=13A rising, predictable carbon price (Borda 77%)
- Linkage and exchangen=7A rising, predictable carbon price (Borda 71%)
- Industry and policy referencen=6A rising, predictable carbon price (Borda 56%)
Regional pathways 42 experts · 7 questions
Allocate China's domestic crude steel production in 2035 across production routes (percent, summing to 100).
China produced roughly 1,000 Mt in 2025, about 90% via BF-BOF.
Box: interquartile range · thick line: median · whiskers: min–max · number: median
| Option | n | Median | IQR | Range | Reference |
|---|---|---|---|---|---|
| BF-BOF, unabated | 28 | 62.0 | 50.0 to 70.0 | 17 to 81 | – |
| BF-BOF with CCUS | 22 | 5.0 | 3.0 to 8.8 | 1 to 15 | – |
| Natural-gas DRI-EAF | 18 | 1.0 | 0.0 to 5.0 | 0 to 27 | – |
| Hydrogen-based DRI-EAF | 26 | 9.0 | 3.0 to 10.0 | 1 to 70 | – |
| Scrap-based EAF | 28 | 22.0 | 15.8 to 28.5 | 8 to 50 | – |
| Other novel routes | 16 | 1.0 | 0.0 to 2.8 | 0 to 10 | – |
By Task 52 affiliation (groups of at least 5)
- Subtask An=5BF-BOF, unabated 80
- Subtask Cn=7BF-BOF, unabated 68
- Linkage and exchangen=8BF-BOF, unabated 58
- Industry and policy referencen=5BF-BOF, unabated 60
By 2035, will China be a net exporter or a net importer of hydrogen-based DRI and HBI, by trade volume?
Mean score 0.1, median 0.0
| Option | Experts | Share |
|---|---|---|
| Significant net exporter, more than 5 Mt per year | 1 | 3% |
| Modest net exporter | 11 | 35% |
| Roughly balanced | 5 | 16% |
| Modest net importer | 8 | 26% |
| Significant net importer, more than 5 Mt per year | 1 | 3% |
| China's green iron trade stays negligible either way | 5 | 16% |
By Task 52 affiliation (groups of at least 5)
- Subtask An=5Modest net importer 40%
- Subtask Cn=7Modest net importer 43%
- Linkage and exchangen=8Modest net exporter 38%
- Industry and policy referencen=6Modest net exporter 50%
Which will be the dominant direct-reduction pathway in India's steel production, by tonnage, in 2035?
| Option | Experts | Share |
|---|---|---|
| Coal-based rotary-kiln DRI remains dominant | 14 | 52% |
| Natural-gas shaft-furnace DRI grows to dominate | 2 | 7% |
| Hydrogen-based DRI reaches commercial scale and dominates new capacity | 3 | 11% |
| BF-BOF expansion outpaces all DRI routes | 8 | 30% |
| No single route dominates | 0 | 0% |
By Task 52 affiliation (groups of at least 5)
- Subtask An=5BF-BOF expansion outpaces all DRI routes 60%
- Subtask Cn=6Coal-based rotary-kiln DRI remains dominant 67%
- Linkage and exchangen=6Coal-based rotary-kiln DRI remains dominant 67%
- Industry and policy referencen=5BF-BOF expansion outpaces all DRI routes 60%
Which route will account for most new primary ironmaking capacity built in the United States between 2025 and 2035?
| Option | Experts | Share |
|---|---|---|
| Natural-gas DRI-EAF with CCS | 5 | 21% |
| Natural-gas DRI-EAF without CCS | 12 | 50% |
| Hydrogen-based DRI-EAF | 0 | 0% |
| BF-BOF, new or relined, unabated | 0 | 0% |
| Scrap-EAF absorbs nearly all growth; little new primary capacity | 7 | 29% |
By Task 52 affiliation (groups of at least 5)
- Subtask Cn=6Natural-gas DRI-EAF without CCS 50%
- Linkage and exchangen=5Natural-gas DRI-EAF without CCS 60%
- Industry and policy referencen=5Natural-gas DRI-EAF without CCS 60%
Of the EU blast-furnace capacity that needs a reinvestment decision by 2030, about three quarters of the fleet, what share will be permanently closed by 2035 with no low-emission replacement built on the same site?
Industry tracking puts the share of EU blast-furnace capacity due for a major reinvestment (relining) decision by 2030 at roughly 70% to 75%: Agora Energiewende's Global Steel Transformation Tracker, as cited by the Climate Bonds Initiative (2022), gives 74%, about 74 Mt; Bellona Europa (2024) says 70% of Europe's steelmaking facilities need major investment before 2030. Earlier Agora analysis (2021) put it at about half. Answer as a share of that at-risk capacity.
Median low
22.0
Median best
49.0
IQR 25.0–55.0
Median high
71.0
One line per expert (lowest to highest plausible), dot: best estimate, sorted by best estimate · shaded band: interquartile range of best estimates · dashed: median
Unit: % of at-risk EU blast-furnace capacity
| Estimate | n | Median | IQR | Range | Mean |
|---|---|---|---|---|---|
| Lowest plausible | 25 | 22 | 20 to 25 | 0 to 70 | 24.6 |
| Best estimate | 25 | 49 | 25 to 55 | 8 to 75 | 42.6 |
| Highest plausible | 25 | 71 | 50 to 75 | 15 to 100 | 63.6 |
By Task 52 affiliation (groups of at least 5)
- Subtask An=5best 40% of at-risk EU blast-furnace capacity
- Subtask Cn=7best 50% of at-risk EU blast-furnace capacity
- Linkage and exchangen=7best 50% of at-risk EU blast-furnace capacity
By 2035, what share of each region's primary iron units for near-zero steel will be imported as HBI or DRI rather than reduced domestically? Use the slider for each region.
One value per region, from 0% (all reduced domestically) to 100% (all imported). Agora Industry and the Renewable Energy Institute estimate imported green HBI could be about 15% cheaper than domestic hydrogen DRI in Japan.
Dot: median · bar: interquartile range
| Row | n | Median % | IQR % | Range % |
|---|---|---|---|---|
| Japan | 24 | 45 | 10 to 63 | 0 to 100 |
| South Korea | 23 | 35 | 5 to 65 | 0 to 100 |
| European Union | 27 | 25 | 20 to 45 | 0 to 90 |
| China | 26 | 5 | 0 to 14 | 0 to 100 |
| India | 24 | 5 | 0 to 11 | 0 to 75 |
By Task 52 affiliation (groups of at least 5)
- Subtask An=5Japan 90%
- Subtask Cn=8South Korea 40%
- Linkage and exchangen=9European Union 25%
- Industry and policy referencen=7South Korea 40%
And by 2050, what share of each region's primary iron units for near-zero steel will be imported as HBI or DRI rather than reduced domestically? Use the slider for each region.
One value per region, from 0% (all reduced domestically) to 100% (all imported). Judge the mature trade pattern once low-cost renewable regions and ore exporters have built out reduction capacity.
Dot: median · bar: interquartile range
| Row | n | Median % | IQR % | Range % |
|---|---|---|---|---|
| Japan | 25 | 65 | 50 to 80 | 10 to 100 |
| South Korea | 23 | 60 | 33 to 70 | 0 to 100 |
| European Union | 26 | 50 | 45 to 60 | 10 to 95 |
| China | 26 | 10 | 5 to 20 | 0 to 70 |
| India | 25 | 10 | 5 to 20 | 0 to 75 |
By Task 52 affiliation (groups of at least 5)
- Subtask An=5Japan 88%
- Subtask Cn=8South Korea 83%
- Linkage and exchangen=8Japan 55%
- Industry and policy referencen=7European Union 60%
Markets, standards and policy 81 experts · 11 questions
What price premium per tonne will buyers sustainably pay for near-zero emission steel in 2030, averaged across segments?
Mean score 76.5, median 75.0
| Option | Experts | Share |
|---|---|---|
| No premium | 6 | 9% |
| Up to USD 50 | 21 | 32% |
| USD 50 to 100 | 23 | 35% |
| USD 100 to 200 | 12 | 18% |
| More than USD 200 | 4 | 6% |
By Task 52 affiliation (groups of at least 5)
- Subtask An=17USD 50 to 100 41%
- Subtask Bn=12USD 50 to 100 42%
- Subtask Cn=9Up to USD 50 56%
- Linkage and exchangen=10USD 50 to 100 60%
- Industry and policy referencen=14Up to USD 50 43%
How far will each end-use sector have moved to near-zero emission steel by 2035?
| Row | n | No change | Pilots only | Slow progress | Rapid progress | Largely transitioned |
|---|---|---|---|---|---|---|
| Automotive | 68 | 0% | 3% | 41% | 40% | 16% |
| Construction and infrastructure | 67 | 12% | 22% | 60% | 6% | 0% |
| Wind, solar and grid equipment | 66 | 6% | 15% | 33% | 36% | 9% |
| Appliances and consumer goods | 66 | 15% | 20% | 44% | 18% | 3% |
| Shipbuilding | 65 | 20% | 29% | 37% | 14% | 0% |
| Machinery and heavy equipment | 64 | 22% | 27% | 44% | 8% | 0% |
By Task 52 affiliation (groups of at least 5)
- Subtask An=16Automotive: Rapid progress 50%
- Subtask Bn=13Automotive: Rapid progress 62%
- Subtask Cn=9Automotive: Slow progress 78%
- Linkage and exchangen=10Automotive: Slow progress 40%
- Industry and policy referencen=16Automotive: Slow progress 38%
How much does each knowledge gap limit decisions by industry and governments today?
| Row | n | Mean | Median | IQR |
|---|---|---|---|---|
| Carbon accounting and certification rules | 60 | 3.92 | 4.0 | 3.0 to 4.3 |
| Comparison of national policy packages | 57 | 3.58 | 4.0 | 3.0 to 4.0 |
| Power-system integration assessment | 59 | 3.54 | 4.0 | 3.0 to 4.0 |
| Plant flexibility and hydrogen buffering requirements | 61 | 3.52 | 4.0 | 3.0 to 4.0 |
| Operating data from demonstration plants | 63 | 3.49 | 4.0 | 3.0 to 4.0 |
| Trade and relocation scenarios | 58 | 3.47 | 3.0 | 3.0 to 4.0 |
| Comparative supply-chain cost model | 56 | 3.46 | 4.0 | 3.0 to 4.0 |
| Processing routes for low-grade ores | 62 | 3.45 | 3.5 | 3.0 to 4.0 |
| Harmonised techno-economic dataset across routes | 61 | 3.16 | 3.0 | 2.0 to 4.0 |
| Workforce and skills requirements | 58 | 2.84 | 3.0 | 2.0 to 3.0 |
By Task 52 affiliation (groups of at least 5)
- Subtask An=19Carbon accounting and certification rules 3.8
- Subtask Bn=12Carbon accounting and certification rules 4.4
- Subtask Cn=8Carbon accounting and certification rules 3.9
- Linkage and exchangen=10Carbon accounting and certification rules 3.8
- Industry and policy referencen=11Comparison of national policy packages 3.8
How important is each safeguard for emissions-accounting schemes covering near-zero and low-emission steel?
1 = not important, 5 = essential.
| Row | n | Mean | Median | IQR |
|---|---|---|---|---|
| Prevention of double counting of emission reductions | 66 | 4.42 | 5.0 | 4.0 to 5.0 |
| Transparent eligibility and boundary rules | 67 | 4.42 | 5.0 | 4.0 to 5.0 |
| Mutual recognition between schemes across borders | 66 | 4.33 | 4.0 | 4.0 to 5.0 |
| Public disclosure of the allocation method used | 67 | 4.28 | 4.0 | 4.0 to 5.0 |
| Physical traceability or chain of custody for the product | 66 | 4.24 | 4.0 | 4.0 to 5.0 |
| Independent third-party verification | 67 | 4.21 | 4.0 | 4.0 to 5.0 |
By Task 52 affiliation (groups of at least 5)
- Subtask An=15Mutual recognition between schemes across borders 4.5
- Subtask Bn=11Prevention of double counting of emission reductions 4.7
- Subtask Cn=11Mutual recognition between schemes across borders 4.5
- Linkage and exchangen=9Transparent eligibility and boundary rules 4.7
- Industry and policy referencen=15Prevention of double counting of emission reductions 4.6
- Not yet assignedn=6Public disclosure of the allocation method used 4.7
By what year, if ever, will one steel product carbon-intensity standard, with shared definitions, system boundary and verification, be mutually recognised across the EU, Japan, Korea, the United States, India and China?
Fill the 10% and 90% years first.
10% chance by
2032
IQR 2030–2036 · never: 2
50% chance by
2040
IQR 2035–2048 · never: 4
90% chance by
2045
IQR 2040–2055 · never: 12
Pooled cumulative probability: average of each expert's piecewise-linear curve through their 10%, 50% and 90% years.
| Percentile | n | Median year | IQR | Range | “Never” |
|---|---|---|---|---|---|
| 10% chance by | 60 | 2032 | 2030 to 2036 | 2027 to 2055 | 2 |
| 50% chance by | 58 | 2040 | 2035 to 2048 | 2030 to 2055 | 4 |
| 90% chance by | 50 | 2045 | 2040 to 2055 | 2032 to 2055 | 12 |
By Task 52 affiliation (groups of at least 5)
- Subtask An=1650% chance by 2040
- Subtask Bn=1150% chance by 2035
- Subtask Cn=750% chance by 2035
- Linkage and exchangen=950% chance by 2040
- Industry and policy referencen=1650% chance by 2040
Rank the three policy instruments most likely to be materially weakened, delayed or reversed by 2030 under political or fiscal pressure.
Borda score as a share of the maximum (rank 1 = 3 points, rank 3 = 1 point) · share ranking it first.
| Option | Borda share | Ranked first | Mentioned |
|---|---|---|---|
| EU ETS free-allocation phase-out timetable, 2026 to 2034 | 60% | 48% | 69% |
| EU CBAM extension to downstream products | 35% | 15% | 54% |
| US Section 232 steel tariffs at 50% | 35% | 15% | 52% |
| India's green steel taxonomy procurement mandate | 16% | 6% | 27% |
| Germany's carbon contracts for difference programme | 14% | 4% | 25% |
| UK CBAM start in 2027 | 11% | 0% | 27% |
| Japan's GX-ETS mandatory phase from 2026 | 10% | 6% | 15% |
| Korea's K-ETS phase 4 steel allocation | 7% | 6% | 10% |
| China's national ETS steel benchmarks | 6% | 0% | 12% |
| Australia's Green Iron Investment Fund | 5% | 0% | 10% |
By Task 52 affiliation (groups of at least 5)
- Subtask An=8EU ETS free-allocation phase-out timetable, 2026 to 2034 (Borda 58%)
- Subtask Bn=11EU CBAM extension to downstream products (Borda 48%)
- Subtask Cn=9EU ETS free-allocation phase-out timetable, 2026 to 2034 (Borda 70%)
- Linkage and exchangen=9EU ETS free-allocation phase-out timetable, 2026 to 2034 (Borda 78%)
- Industry and policy referencen=13EU ETS free-allocation phase-out timetable, 2026 to 2034 (Borda 79%)
From 2026 CBAM treats imported DRI and HBI as reportable precursors, mostly on verified actual emissions data. How will this affect the competitiveness of imported hydrogen-based iron against EU-produced hydrogen DRI by 2030?
| Option | Experts | Share |
|---|---|---|
| Materially favours EU production; the compliance burden is a real barrier | 10 | 19% |
| Roughly neutral; well-documented low-carbon exporters are not disadvantaged | 25 | 47% |
| Materially favours verified low-carbon imports over EU producers on higher-carbon grids | 8 | 15% |
| Too uncertain; verification capacity will decide case by case | 10 | 19% |
By Task 52 affiliation (groups of at least 5)
- Subtask An=12Materially favours EU production; the compliance burden is a real barrier 33%
- Subtask Bn=8Roughly neutral; well-documented low-carbon exporters are not disadvantaged 50%
- Subtask Cn=7Roughly neutral; well-documented low-carbon exporters are not disadvantaged 43%
- Linkage and exchangen=9Materially favours verified low-carbon imports over EU producers on higher-carbon grids 33%
- Industry and policy referencen=15Roughly neutral; well-documented low-carbon exporters are not disadvantaged 67%
Under what conditions are carbon contracts for difference most effective in supporting delivery of hydrogen DRI projects? Select up to three.
Share of respondents selecting each option.
| Option | Experts | Share selecting |
|---|---|---|
| Coverage of both the carbon-price gap and the hydrogen or electricity cost gap | 41 | 76% |
| Contract duration of ten years or more | 33 | 61% |
| Combination with demand-side measures such as lead markets or quotas | 28 | 52% |
| A predictable carbon price and free-allocation phase-out path | 24 | 44% |
| Pairing with grid-connection and hydrogen-supply guarantees | 16 | 30% |
| Eligibility open to phased, gas-first plants | 11 | 20% |
| Fast award with limited conditionality | 1 | 2% |
By Task 52 affiliation (groups of at least 5)
- Subtask An=12Coverage of both the carbon-price gap and the hydrogen or electricity cost gap 67%
- Subtask Bn=11Coverage of both the carbon-price gap and the hydrogen or electricity cost gap 82%
- Subtask Cn=7Contract duration of ten years or more 71%
- Linkage and exchangen=8Coverage of both the carbon-price gap and the hydrogen or electricity cost gap 63%
- Industry and policy referencen=14Coverage of both the carbon-price gap and the hydrogen or electricity cost gap 93%
If the EU's hourly renewable-matching requirement for RFNBO hydrogen takes effect as legislated, by what percentage would it raise the levelised cost of hydrogen delivered to a DRI plant at a typical European site in 2032, compared with annual matching?
Industry estimates range from a few percent to about one third; five member states are seeking a delay to 2035.
Median low
8.0
Median best
20.0
IQR 16.0–35.0
Median high
35.0
One line per expert (lowest to highest plausible), dot: best estimate, sorted by best estimate · shaded band: interquartile range of best estimates · dashed: median
Unit: % increase in delivered hydrogen cost
| Estimate | n | Median | IQR | Range | Mean |
|---|---|---|---|---|---|
| Lowest plausible | 21 | 8 | 5 to 20 | 0 to 50 | 14.2 |
| Best estimate | 21 | 20 | 16 to 35 | 5 to 80 | 27.4 |
| Highest plausible | 21 | 35 | 30 to 50 | 15 to 100 | 44.0 |
By Task 52 affiliation (groups of at least 5)
- Subtask An=8best 25% increase in delivered hydrogen cost
- Subtask Bn=5best 20% increase in delivered hydrogen cost
Steel entered China's national emissions trading scheme in 2025 with intensity-based free allocation. How will this affect Chinese steel-sector emissions by 2030?
Mean score 1.9, median 2.0
| Option | Experts | Share |
|---|---|---|
| Material reduction; the scheme meaningfully cuts sector emissions | 4 | 8% |
| Modest reduction, mainly efficiency gains with little route switching | 26 | 52% |
| Negligible; intensity-based free allocation avoids most real cost | 10 | 20% |
| Too early to judge from the first compliance cycle | 10 | 20% |
By Task 52 affiliation (groups of at least 5)
- Subtask An=13Modest reduction, mainly efficiency gains with little route switching 54%
- Subtask Bn=11Modest reduction, mainly efficiency gains with little route switching 64%
- Subtask Cn=6Modest reduction, mainly efficiency gains with little route switching 33%
- Linkage and exchangen=7Modest reduction, mainly efficiency gains with little route switching 86%
- Industry and policy referencen=10Negligible; intensity-based free allocation avoids most real cost 40%
By 2040, what requirements do you expect to apply when an existing blast furnace seeks permission to reline, by jurisdiction?
Choose the most likely requirement in each jurisdiction. Leave a row as not my expertise if you have no view.
| Row | n | No specific climate requirement | An emissions-reduction plan or abatement-readiness condition | Abatement (CCUS or hydrogen injection) required at reline | Relining of unabated furnaces not permitted |
|---|---|---|---|---|---|
| European Union | 51 | 2% | 14% | 33% | 51% |
| China | 48 | 10% | 46% | 33% | 10% |
| India | 49 | 47% | 47% | 4% | 2% |
| United States | 47 | 36% | 40% | 13% | 11% |
| Japan | 45 | 4% | 40% | 47% | 9% |
| Korea | 46 | 4% | 39% | 43% | 13% |
| Other major steel-producing countries | 42 | 29% | 60% | 10% | 2% |
By Task 52 affiliation (groups of at least 5)
- Subtask An=15European Union: Relining of unabated furnaces not permitted 40%
- Subtask Bn=11European Union: Relining of unabated furnaces not permitted 60%
- Subtask Cn=8European Union: Relining of unabated furnaces not permitted 63%
- Linkage and exchangen=9European Union: Relining of unabated furnaces not permitted 71%
- Industry and policy referencen=12European Union: Abatement (CCUS or hydrogen injection) required at reline 55%